
Profiles in c\our/arnage
Profiles in c\our/arnage
Age spectrum profiles & symptom spectrum profiles changed 2020 to 2021

A rare first-person article
I struggled to write this article because my eldest son died four years ago July 13. For emotional support, I used to attend a monthly group of fathers who lost children, but they told me not to come anymore because I’m “not vaccinated.” Instead, I do C19 data research now because I want to save other parents from living through what Ernie Ramirez and I and so many other parents have to go through for the rest of our lives.
Having read thousands of death certificates, there is no doubt in my mind the C19 vaccine caused and is causing death and maim. Mourning families are never fully happy again. The death lottery claims its winners.
So please pardon the sloppy haste of this article written in colloquial first-person prose.
Caveats
There was no differentiation between immediate and underlying causes when I accumulated the data. If an ICD-10 code appears in a record, it was counted.
There are no definitive answers because there are too many confounders, fraud being a huge confounder in Massachusetts, perhaps the leading state in USA in fraudulent C19 recording.
Profiles may match and correlate, but that does not mean they are causally linked. However, dramatically disparate profiles is strong evidence they are not causally linked. And that is the crux of this article.
I hope that researchers take up age spectrum profile and symptom spectrum profile research as a means to show 1) broken fidelity in data recording and 2) death and maim from the C19 vaccine … or Remdesivir … or untested CDC recommendations. I made up the terms; so you will not find them elsewhere. Perhaps age distribution or symptom set are used in the epidemiological world.
Thesis
Something not C19 killed thousands and continues to kill in Massachusetts.
The data is clear in that some causes of death have inverse profile relationships with C19. These causes increased dramatically in from 2015-2019 to 2020 and then again from 2020 to 2021, while C19 deaths were cut in half from 2020 to 2021.
The C19 vaccine must be stopped. It clearly saves no one and all these elevated causes of death may or may not be causally linked to the C19 vaccine. That’s a gamble not worth pursuing.
Thank you to those who donated to CdC. File sizes were too big for my computer and I could not work for weeks. I then used the donations to buy new hardware and get up and running again. I’m very humbled to have received donations and I want you to know that the money facilitated the generation of much of the data in this article.
Thank you so much and God bless you all who read and take part in the virtuous path of fighting for natural rights and individual liberties. Please read John 14:6. Something divine happened to me again on the 4th anniversary day of my son’s passing. I’m still in awe of the messages I received from God two years apart.
If you recognize value in my articles, please feel free to donate to this PayPal account. Thank you. God Bless you.
John 14:6
https://www.paypal.com/donate/?hosted_button_id=Y37NBXPWGXL2S
Begin article
The data used throughout is from the Massachusetts Department of Public Health (“MA DPH”). The updated data was received in June 2022. The article using the data received March 2022 can be viewed in C19 vaccines - the cause of causes found here. The 2022 data will be analyzed in a separate article.
People mentioned that the data and analyses in CdC articles are too complicated. If you read no more than what’s before the Introduction, you should get the gist of the “disparate profile” comparisons herein.
Diseases and ailments generally have data profiles, like finger prints of the disease. Genetic diseases and cancers have age spectrum profiles and symptom spectrum profiles. Respiratory viruses additionally have seasonal trigger profiles.
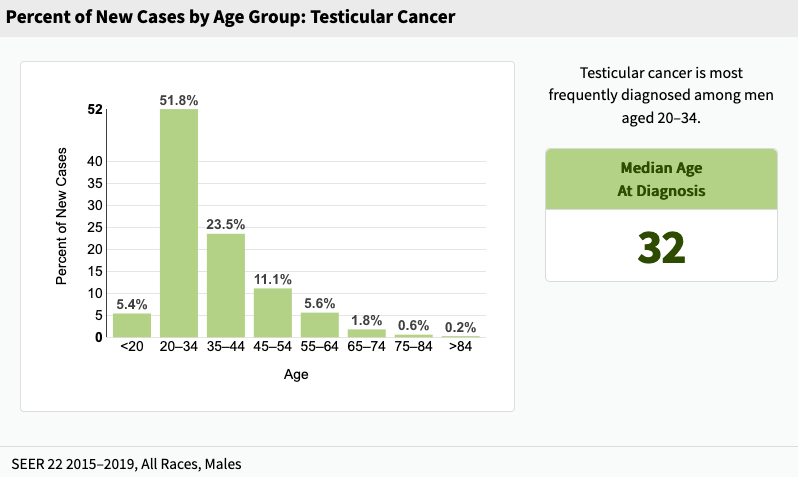
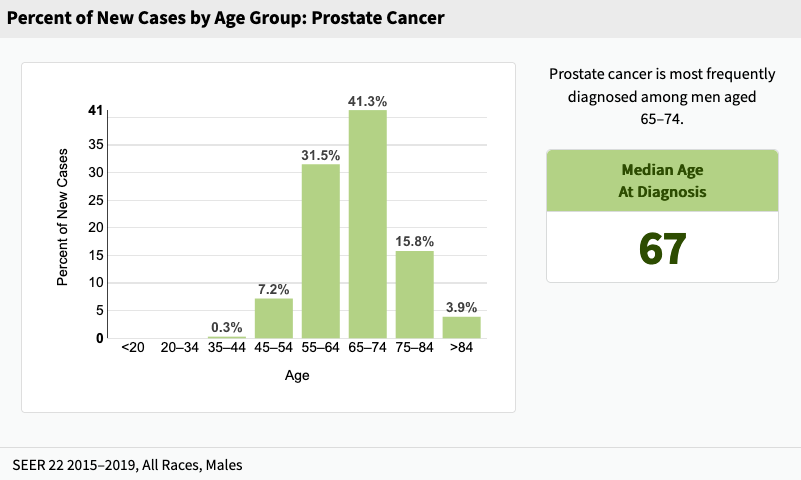
Although cancers are very different from viruses, the above bar graphs were selected to best show two very different age spectrum profiles. They are what was available in web searches.
Put simply, younger men get testicular cancer and older men get prostate cancer. The median ages are 35 years apart. These graphs from the National Institutes of Health are found here and here.
A disease profile is generally static in age and symptoms.
The important theme of this article is that the profiles change from 2020 to 2021. There will be shown differences in age spectrum profiles and symptom spectrum profiles. Seasonal trigger profiles are already known to be disparate from 2020 to 2021 and will not be shown below. Even in our current situation in 2022, there are strange and unseasonable C19 illnesses going around. Summer colds used to be rare, but are this year prevalent.
In C19 vaccine - the cause of causes, near the end of the article, there was noted a change from predominantly seasonal pneumonia-like deaths in 2020 to predominantly unseasonal circulatory system deaths in 2021. Those circulatory issues can also be considered internal injuries manifested in heart attacks, strokes, pulmonary emboli, tachycardia, arrhythmia, and others. Perhaps these causes were sustained from some type of substance infiltrating the blood stream. How else could something wreak havoc across so many organs and vessels quickly, in some cases, and over months, in other cases?
Nine hundred eighty seven (987) R99 code records (holding bin) from the March 2022 version are resolved in the June 2022 version; and the remaining ~400 R99 codes are now similar in quantity to years 2015-2020.
Introduction
Demonstrated below are differences in age spectrum profiles and symptom spectrum profiles from 2020 to 2021 for a few causes followed by a voluminous set of tables and graphs for use by other researchers to also find patterns that do not match what C19 is purported to be by government, politicians, and media.
Age spectrum profile of C19 fatalities
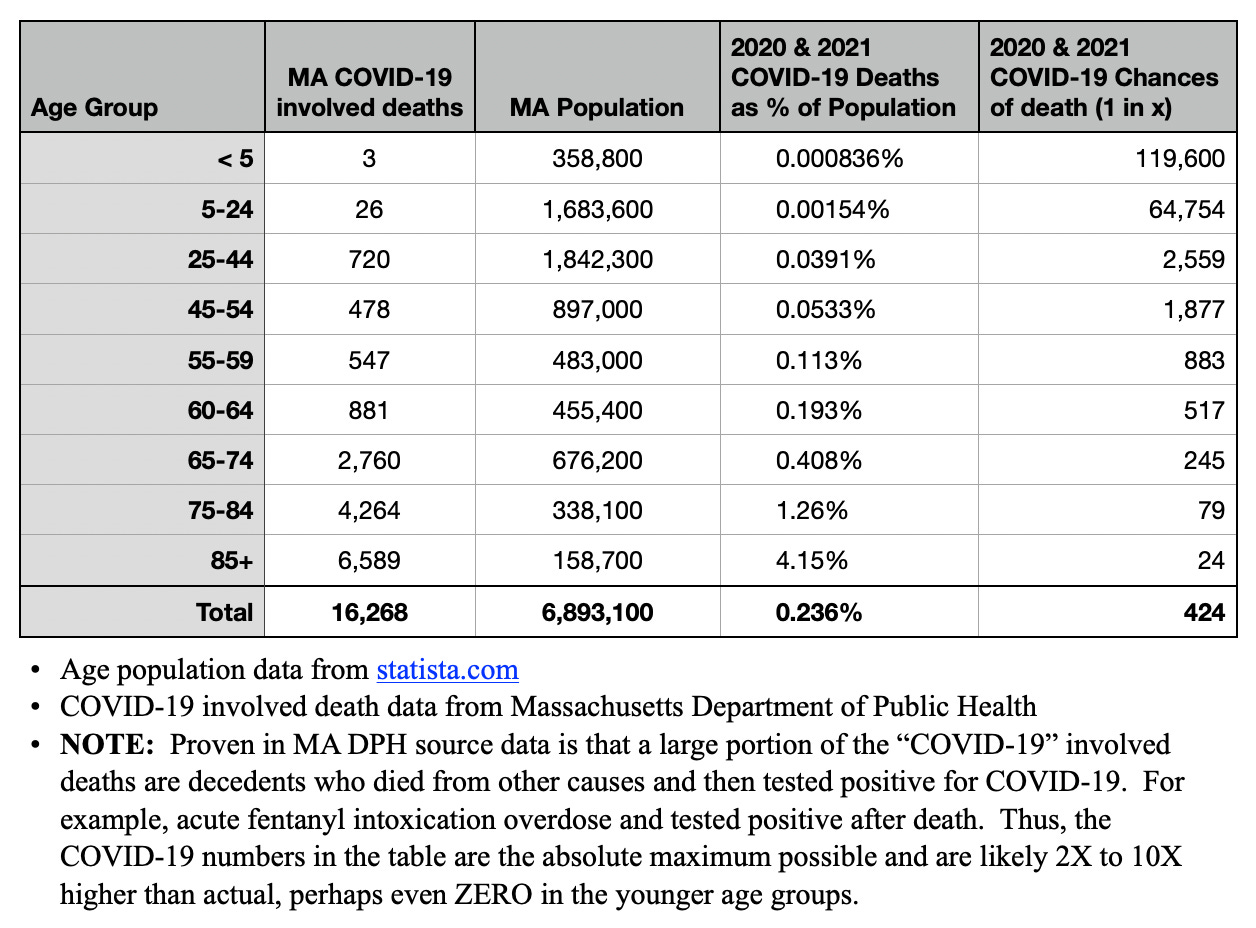
The table above demonstrates that, even with the inflated and fraudulent C19 death numbers in Massachusetts, proven in Scienter, not science, C19 was not a health emergency for anyone under 60 years of age. Many of the younger C19-labeled deaths were actually caused by car accidents, fentanyl overdoses, severe life threatening illnesses, and other non-C19 root causes of death. C19 simply is not what the public was told.
All-cause age spectrum profile switchover 2020 to 2021
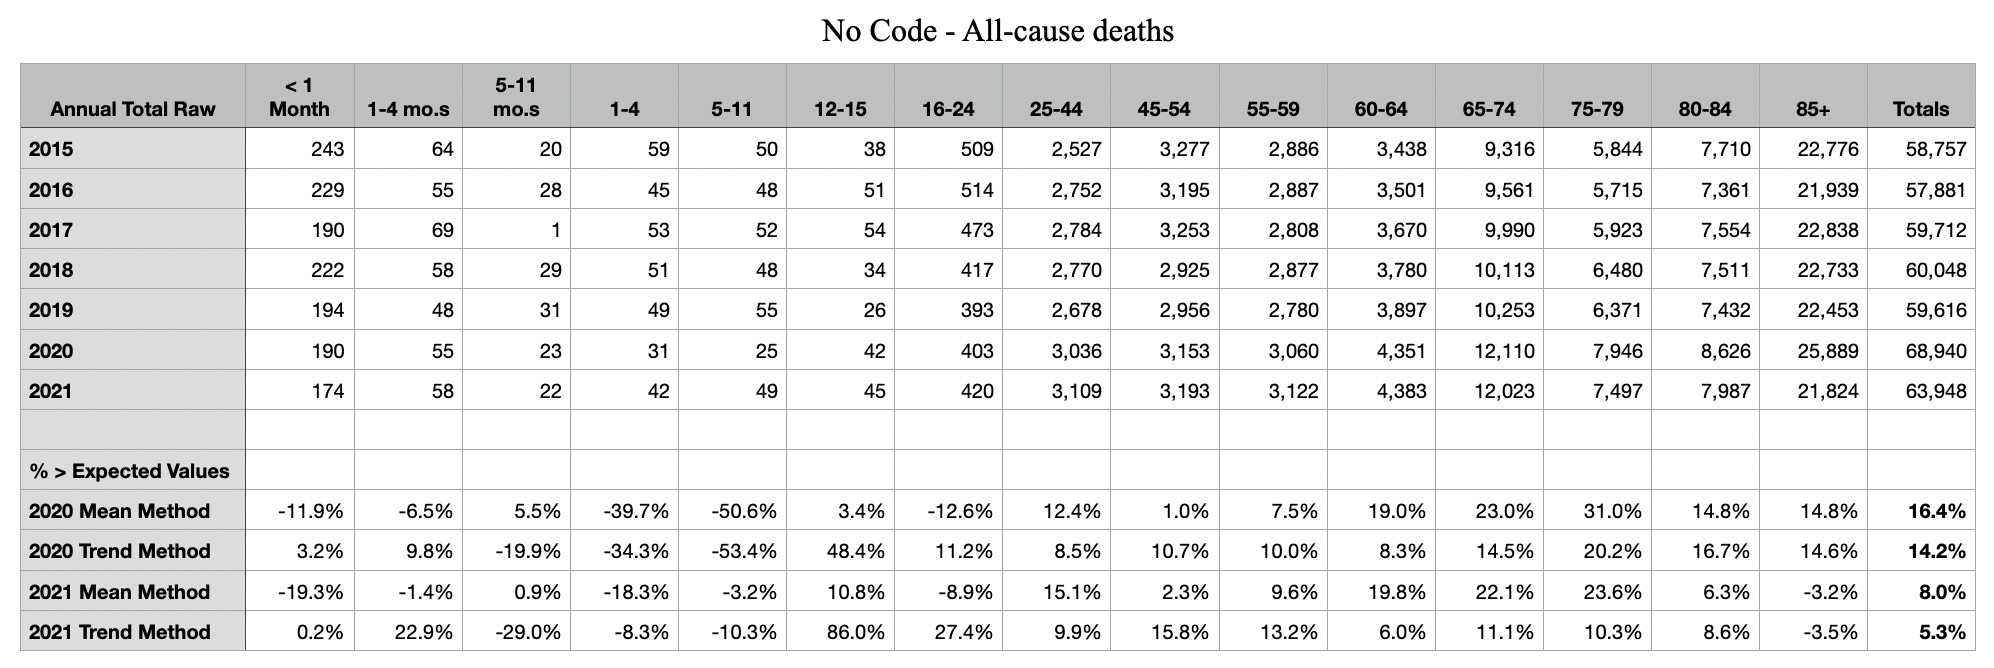
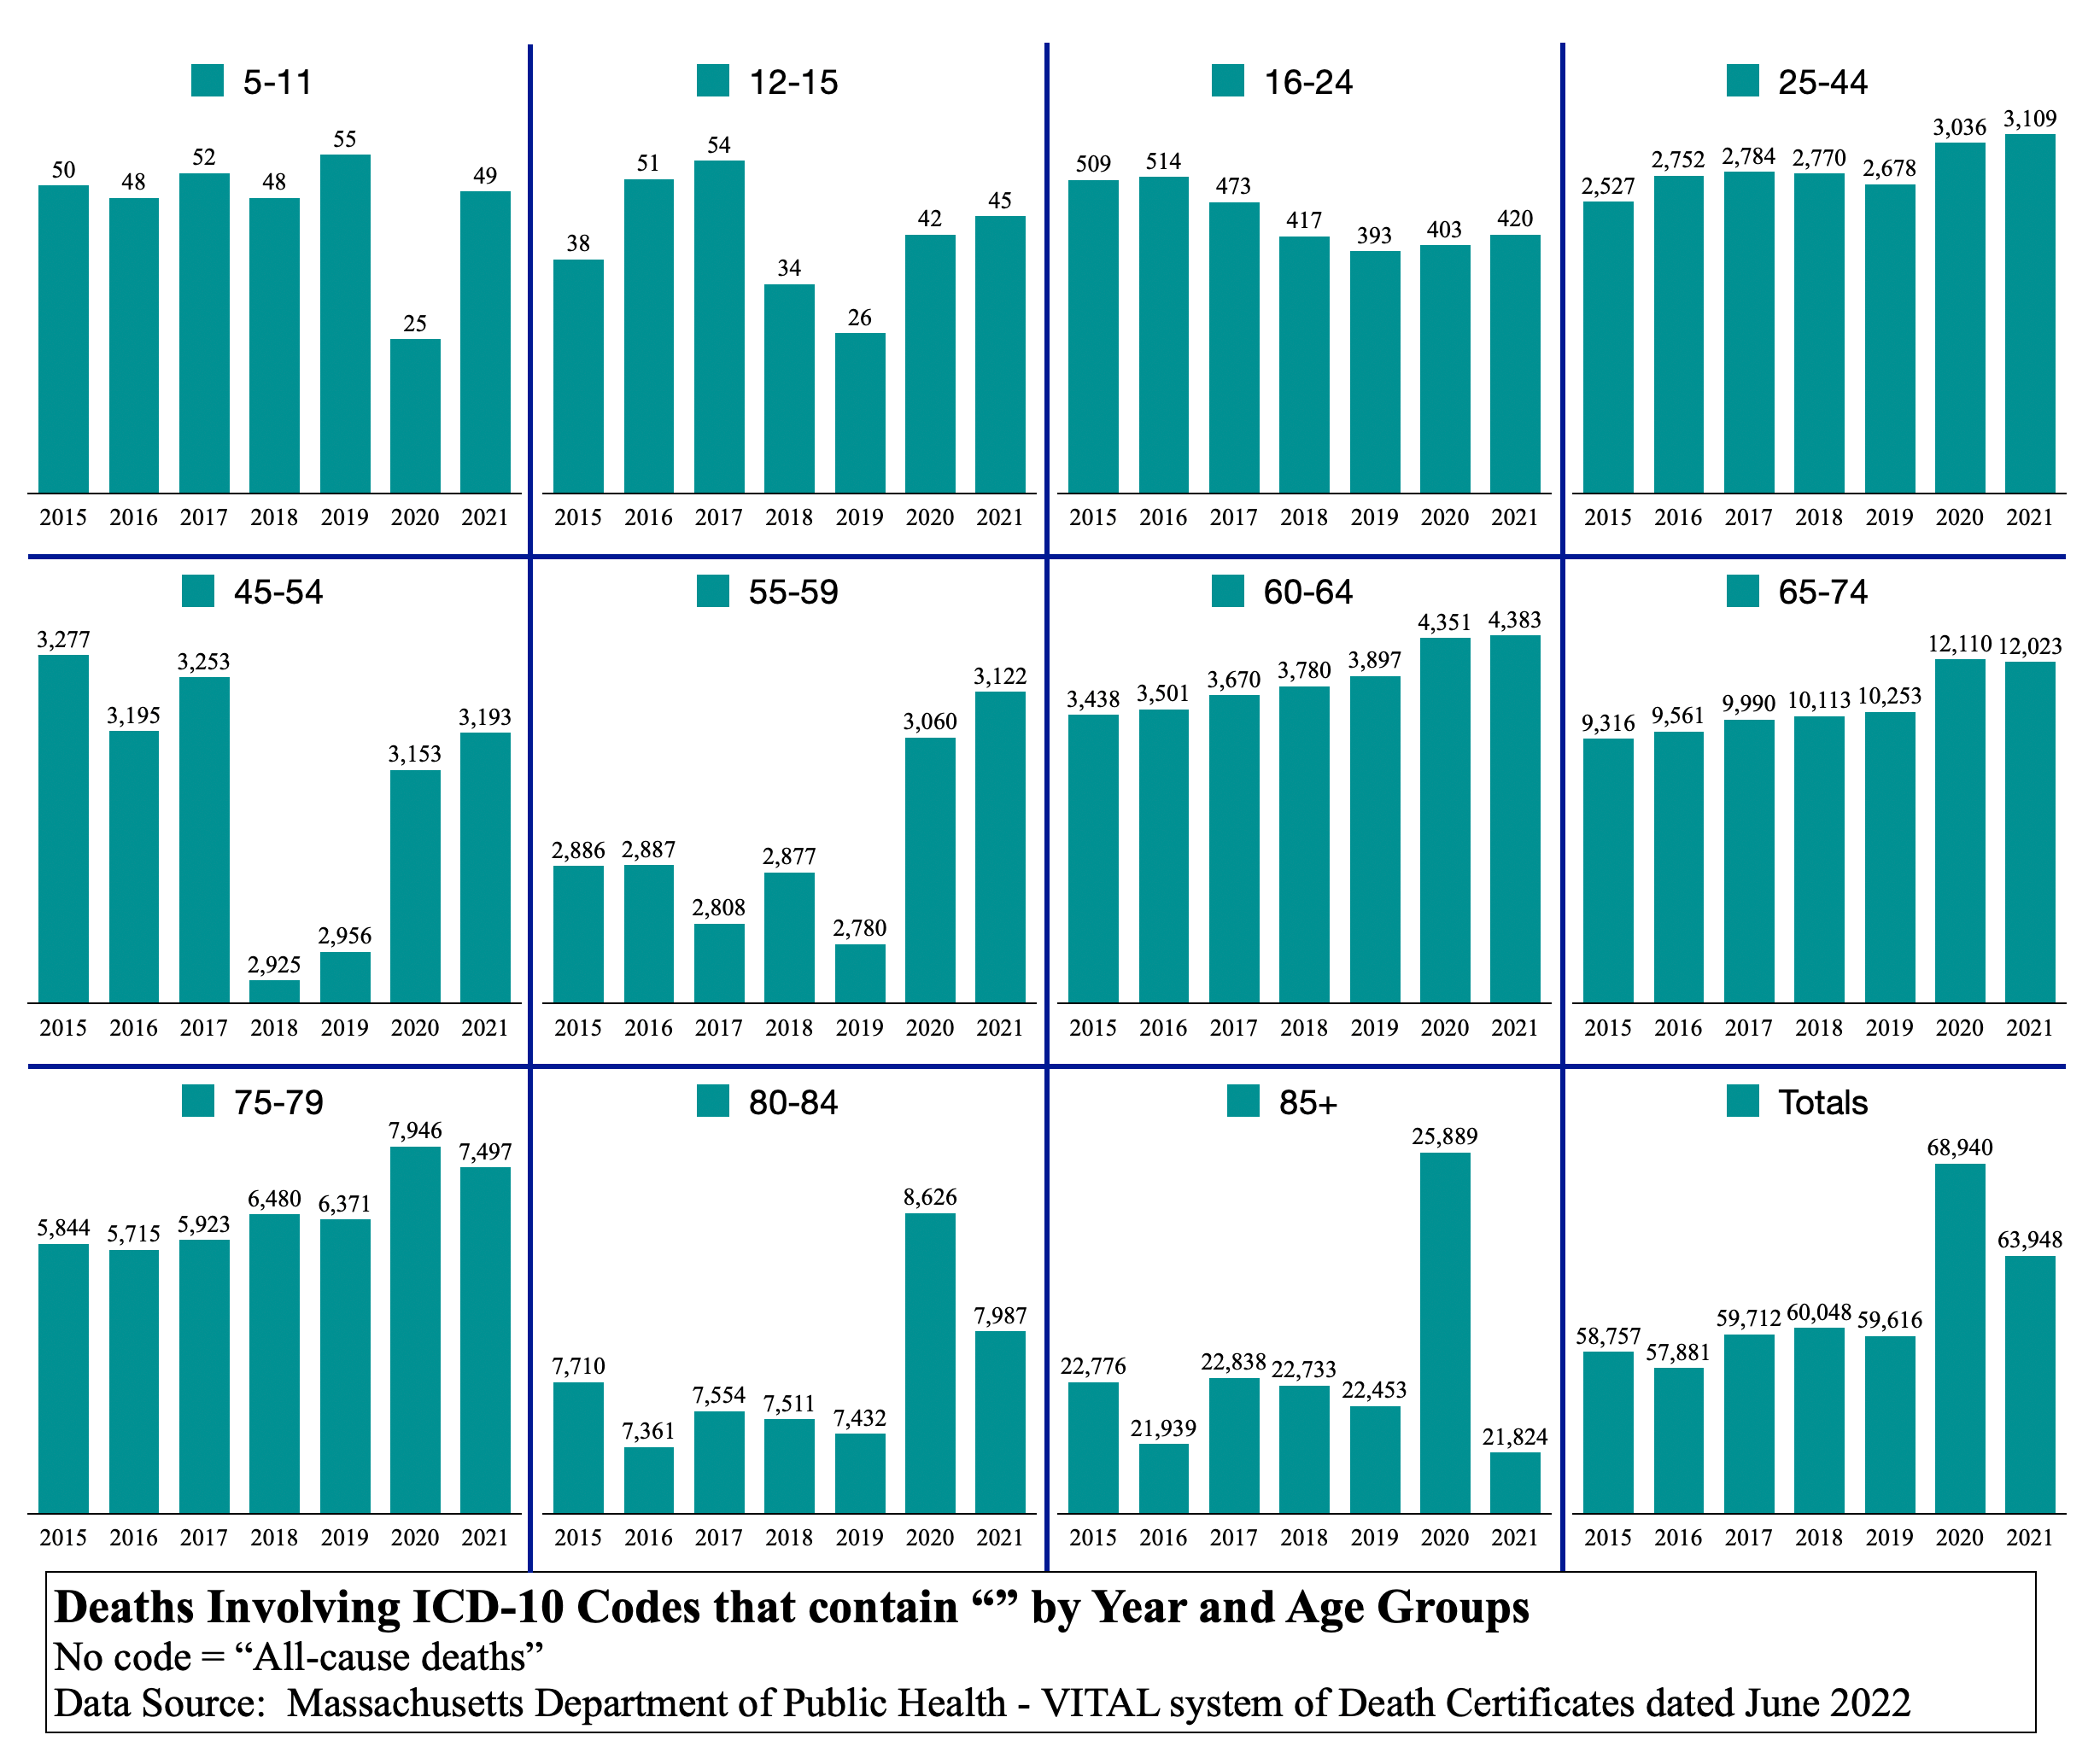
The table and graphs above are all-cause deaths by age group. There is a very strange thing happening in this chart set. Notice 2020 and 2021 bars in each age group. 2021 is consistently higher than 2020 until the age of 65, where it switches. The percent differences from 2020 to 2021 by age group are {96%, 7%, 4%, 2%, 1%, 2%, 0.7%, (0.7%), (6%), (7%), (16%)}.
The trending of the switchover is nearly perfect in diminishing positive, switching over, then growing negative. Check the other year-to-year transitions to see if something this consistent occurs. It does not. Why would the same virus kill more elderly in 2020 and then kill a younger age spectrum profile in 2021? The younger did relatively worse and the older did relatively better in 2021 than in 2020. The age spectrum profile shifted to the left significantly, year over year. It should not do that, though there could be many reasons.
Notice also that age group 85+ in 2021 is not only fewer than 2020, but it is fewer than every one of years 2015 through 2019. Where’s the emergency? Where’s the pandemic?
Purported COVID-19 age spectrum profile of fatalities

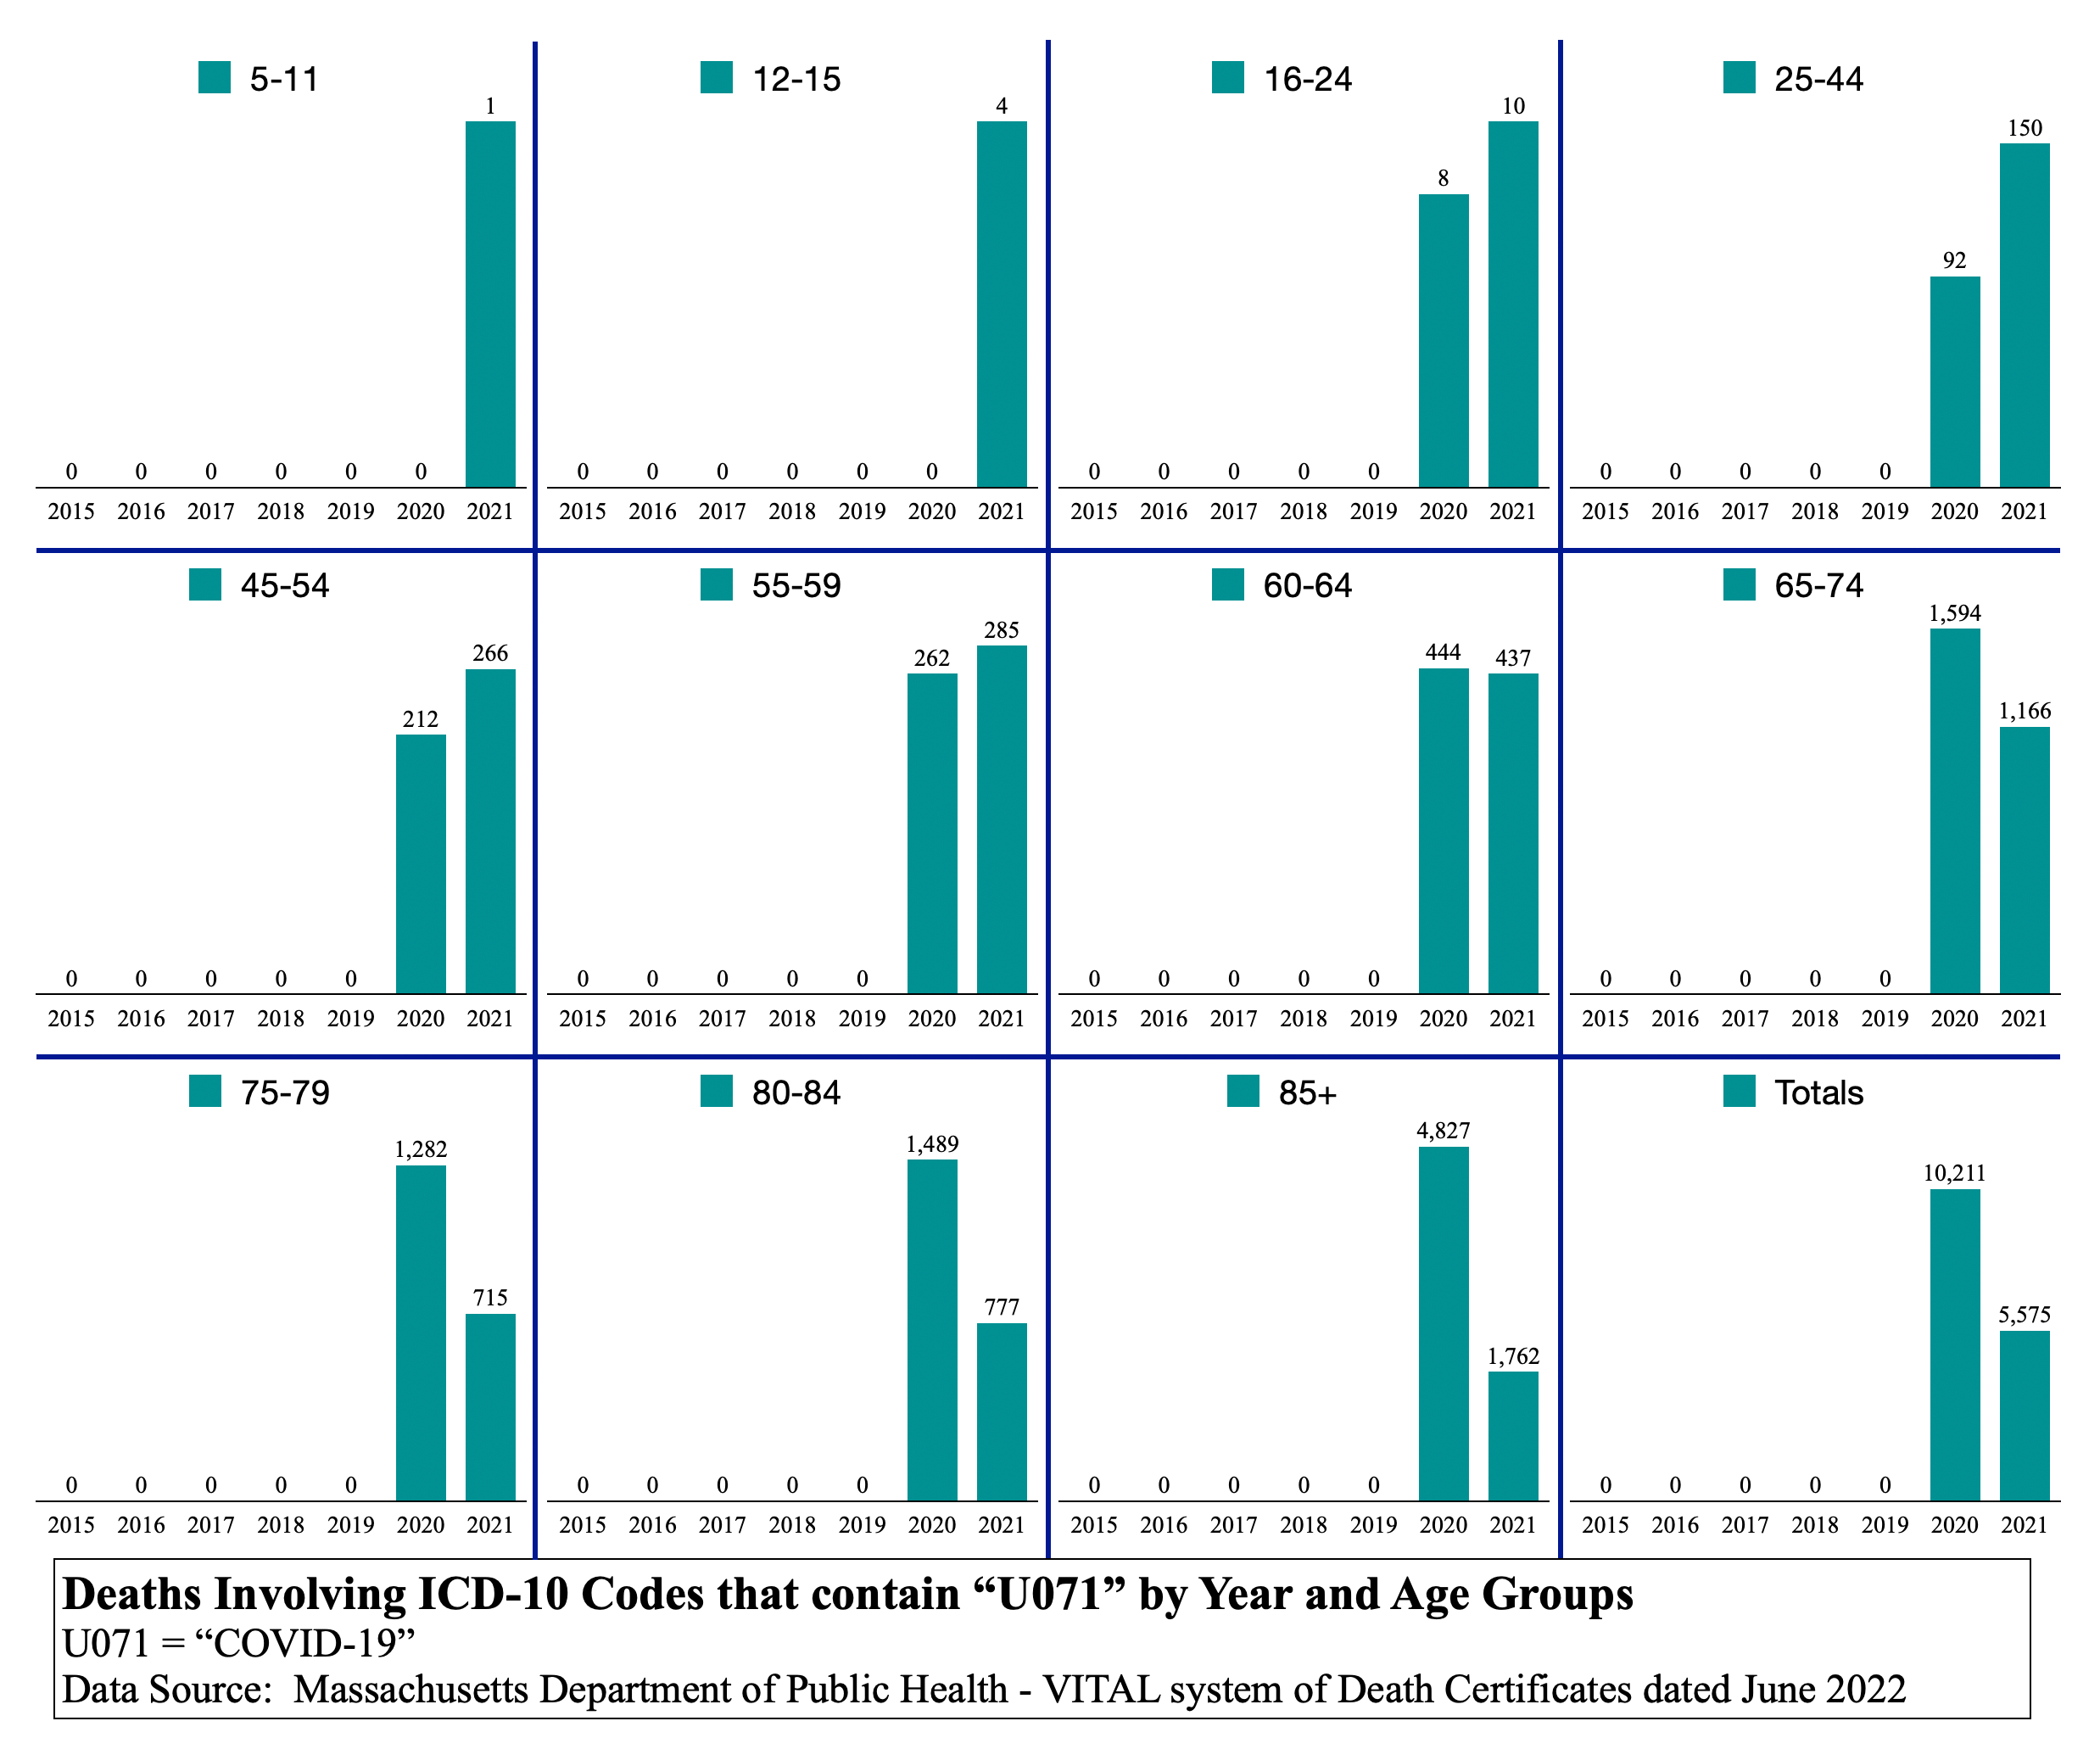
The same switchover phenomenon occurred in cause C19 (“U071”) as did in the all-cause set of bar graphs. More younger died in 2021 and more older died in 2020. Why is this happening? If C19 was really the cause of the deaths labeled as C19, why was there a significant change in age spectrum profile from 2020 to 2021? And perhaps C19 labeled deaths are what drove the all-cause deaths to be what they are in 2020 and 2021. The question remains: why is there so different a profile year over year?
Example age group 25-44
In the age group 25-44, C19 deaths were 3.0% of the all-cause deaths in 2020. But in 2021, they were 4.8%. That’s a 59% increase in age 25-44 C19 deaths as a percentage of all age 25-44 deaths year over year.
Comments
Since there were so few deaths in younger age groups in 2020, people were beginning to talk of the government measures being unnecessary. They were talking of the vaccine being unnecessary for all but the old and frail. In order to continue the narrative that C19 is deadly to more than just the old and frail, it was easy to add the C19 “U071” label to death certificates of younger people in 2021. This is one theory. Or you can believe that younger people actually started dying from less virulent variants when they survived more virulent ones the year before. Else, the only other difference is that most younger people took needles in the arm at least twice in 2021.
In Scienter, not science many younger decedents are shown to be drug overdoses whose bodies then tested positive post-mortem. Also, car accident victims of blunt force trauma tested positive after death and were counted as C19 deaths.
Again, in Scienter, not science, there is described a 48yo male listed as having died from C19, but known to have received the vaccine less than 24 hours before death. The Massachusetts medical examiners were busy writing “U071” on many death certificates regardless of what the real cause of death was. This is fraud on a medical record, which rises under many federal felony statutes.
N179 again (Acute renal failure, id est, sudden kidney failure)
N179 deserves another look even though only a few deaths were added across age groups. The original article N179 is found here.
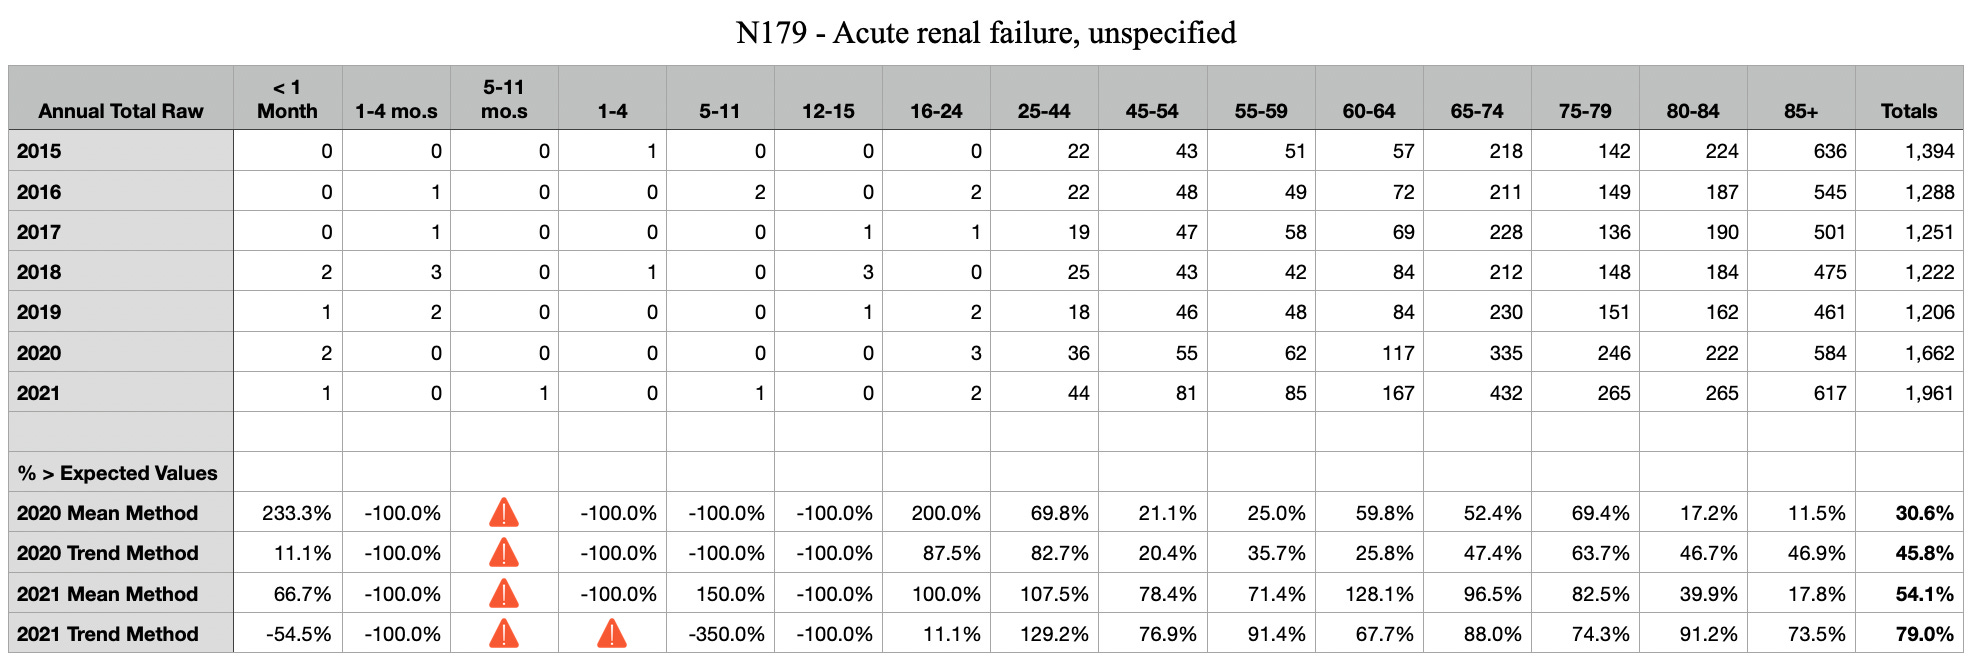
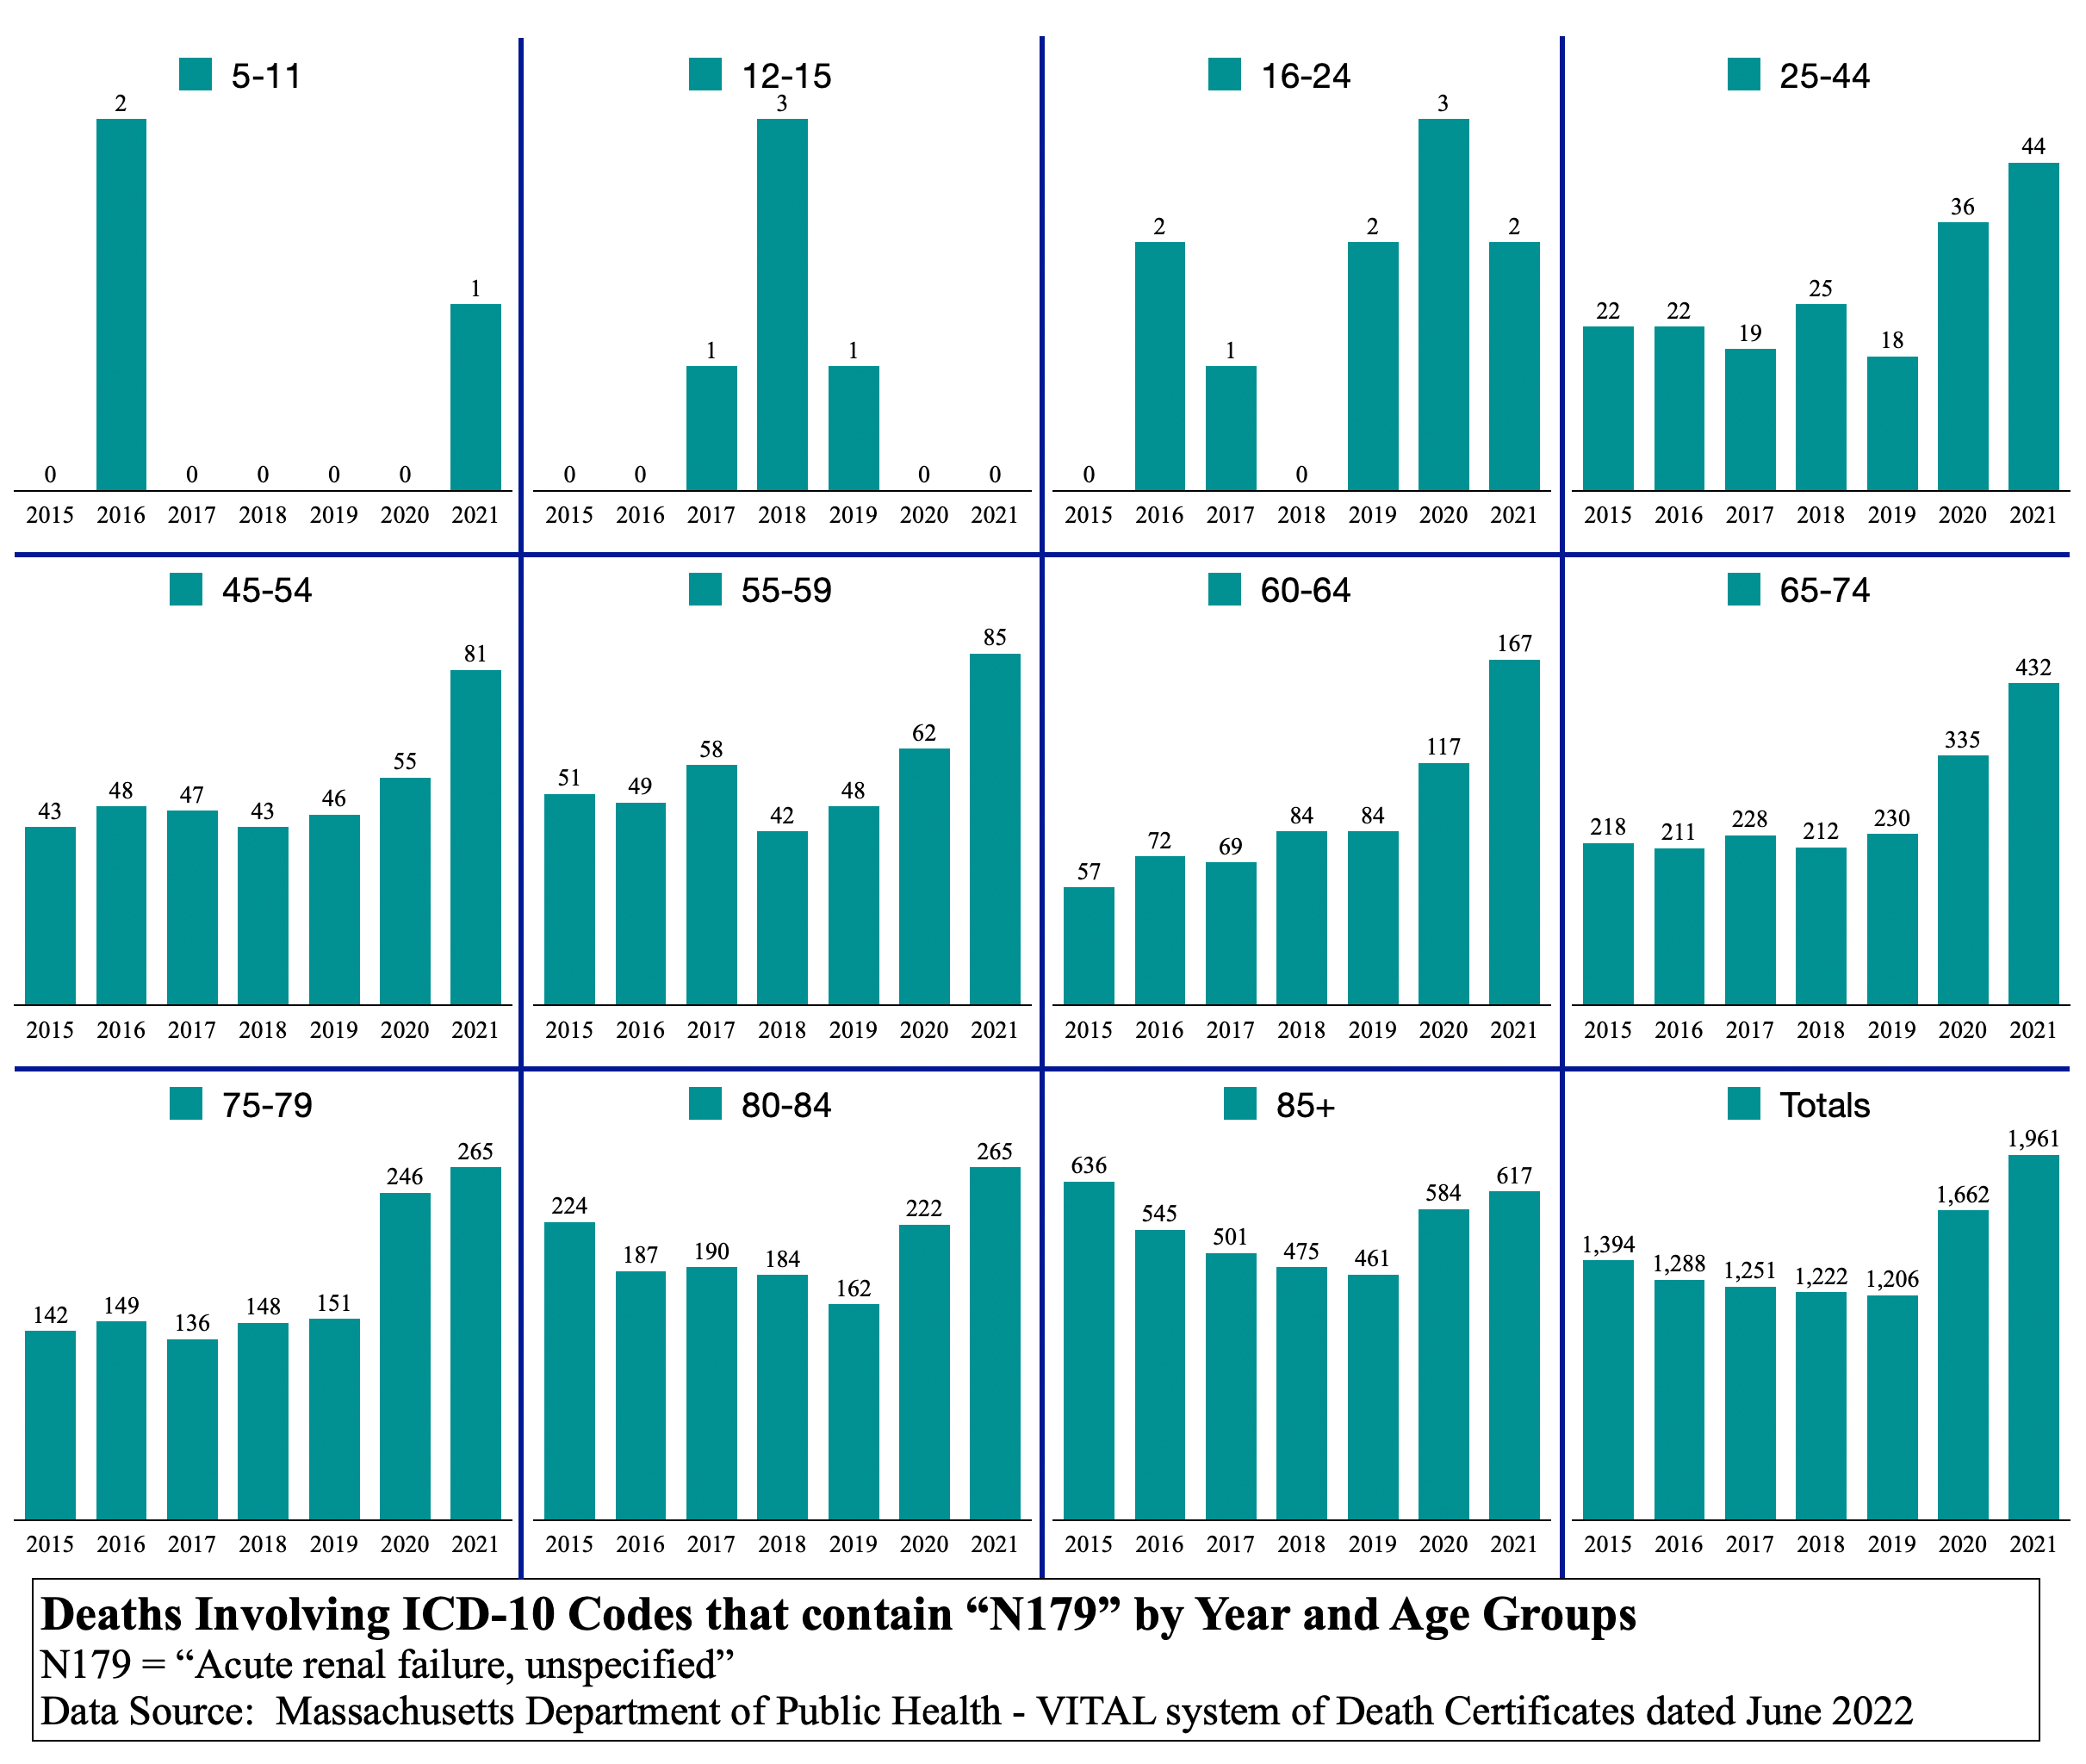
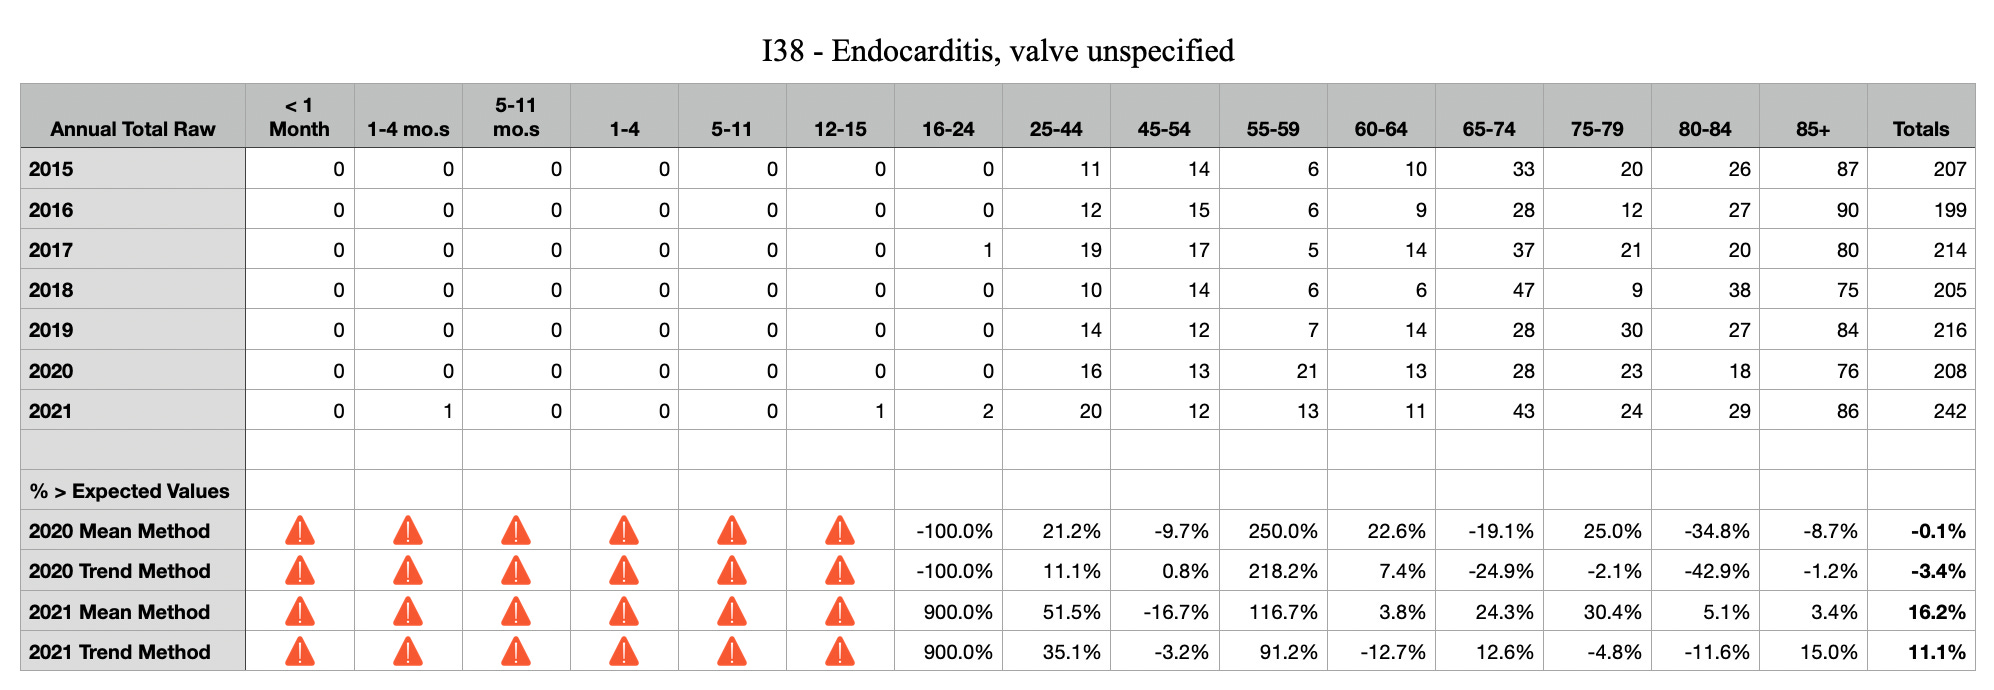
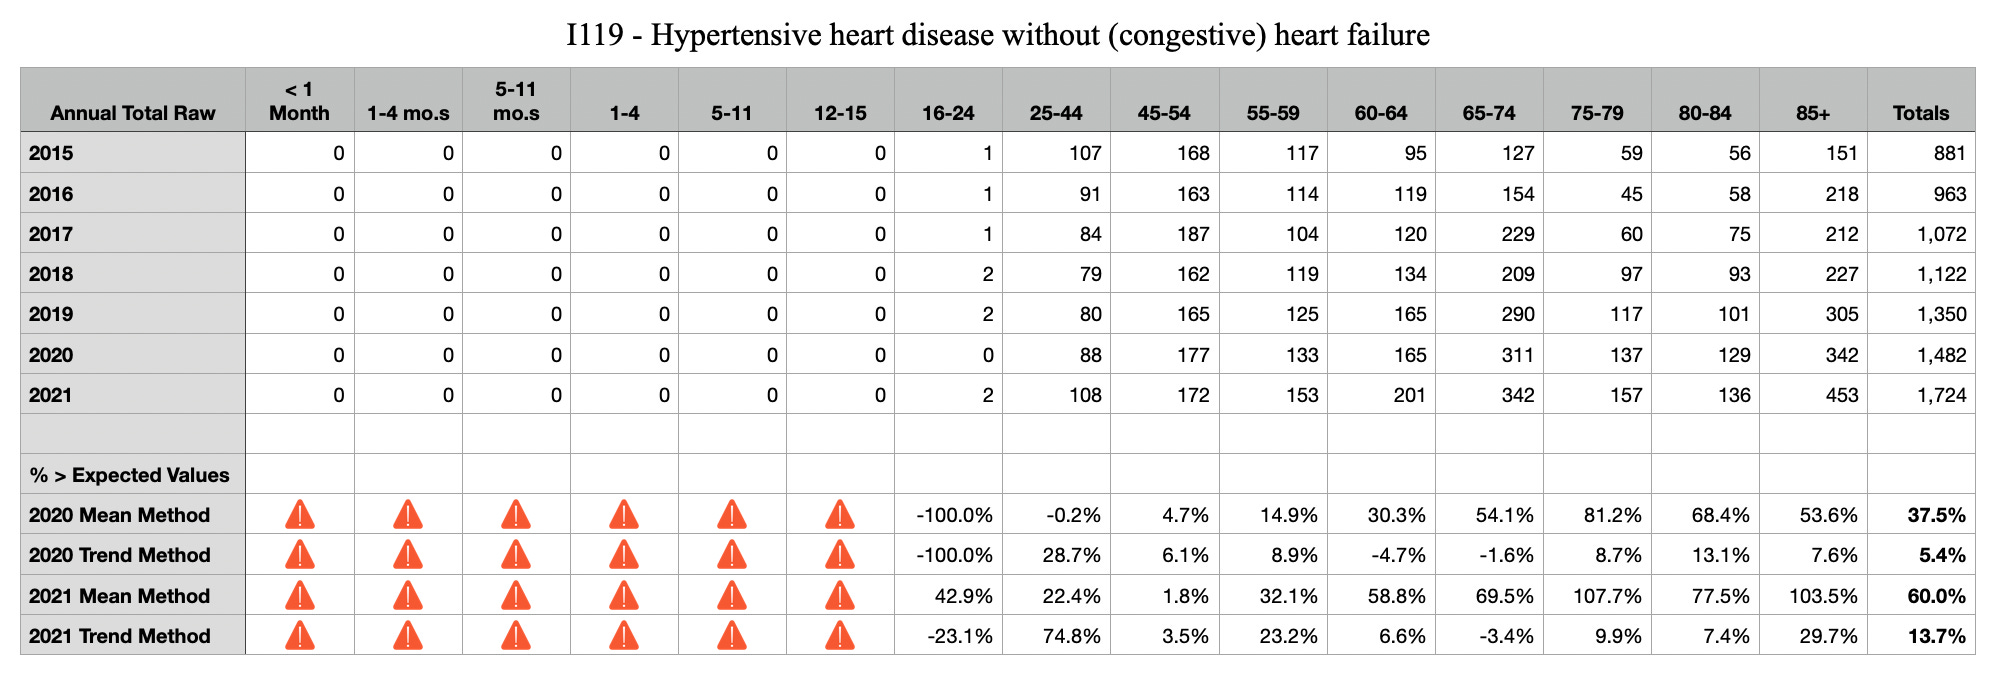
In order to show disparity in symptom spectrum profiles, look at the N179 graph set above. Notice that there is no switchover. 2021 is consistently higher than 2020 in N179 related deaths in all age groups over age 16-24. And 2020 is consistently higher than 2015-2019.
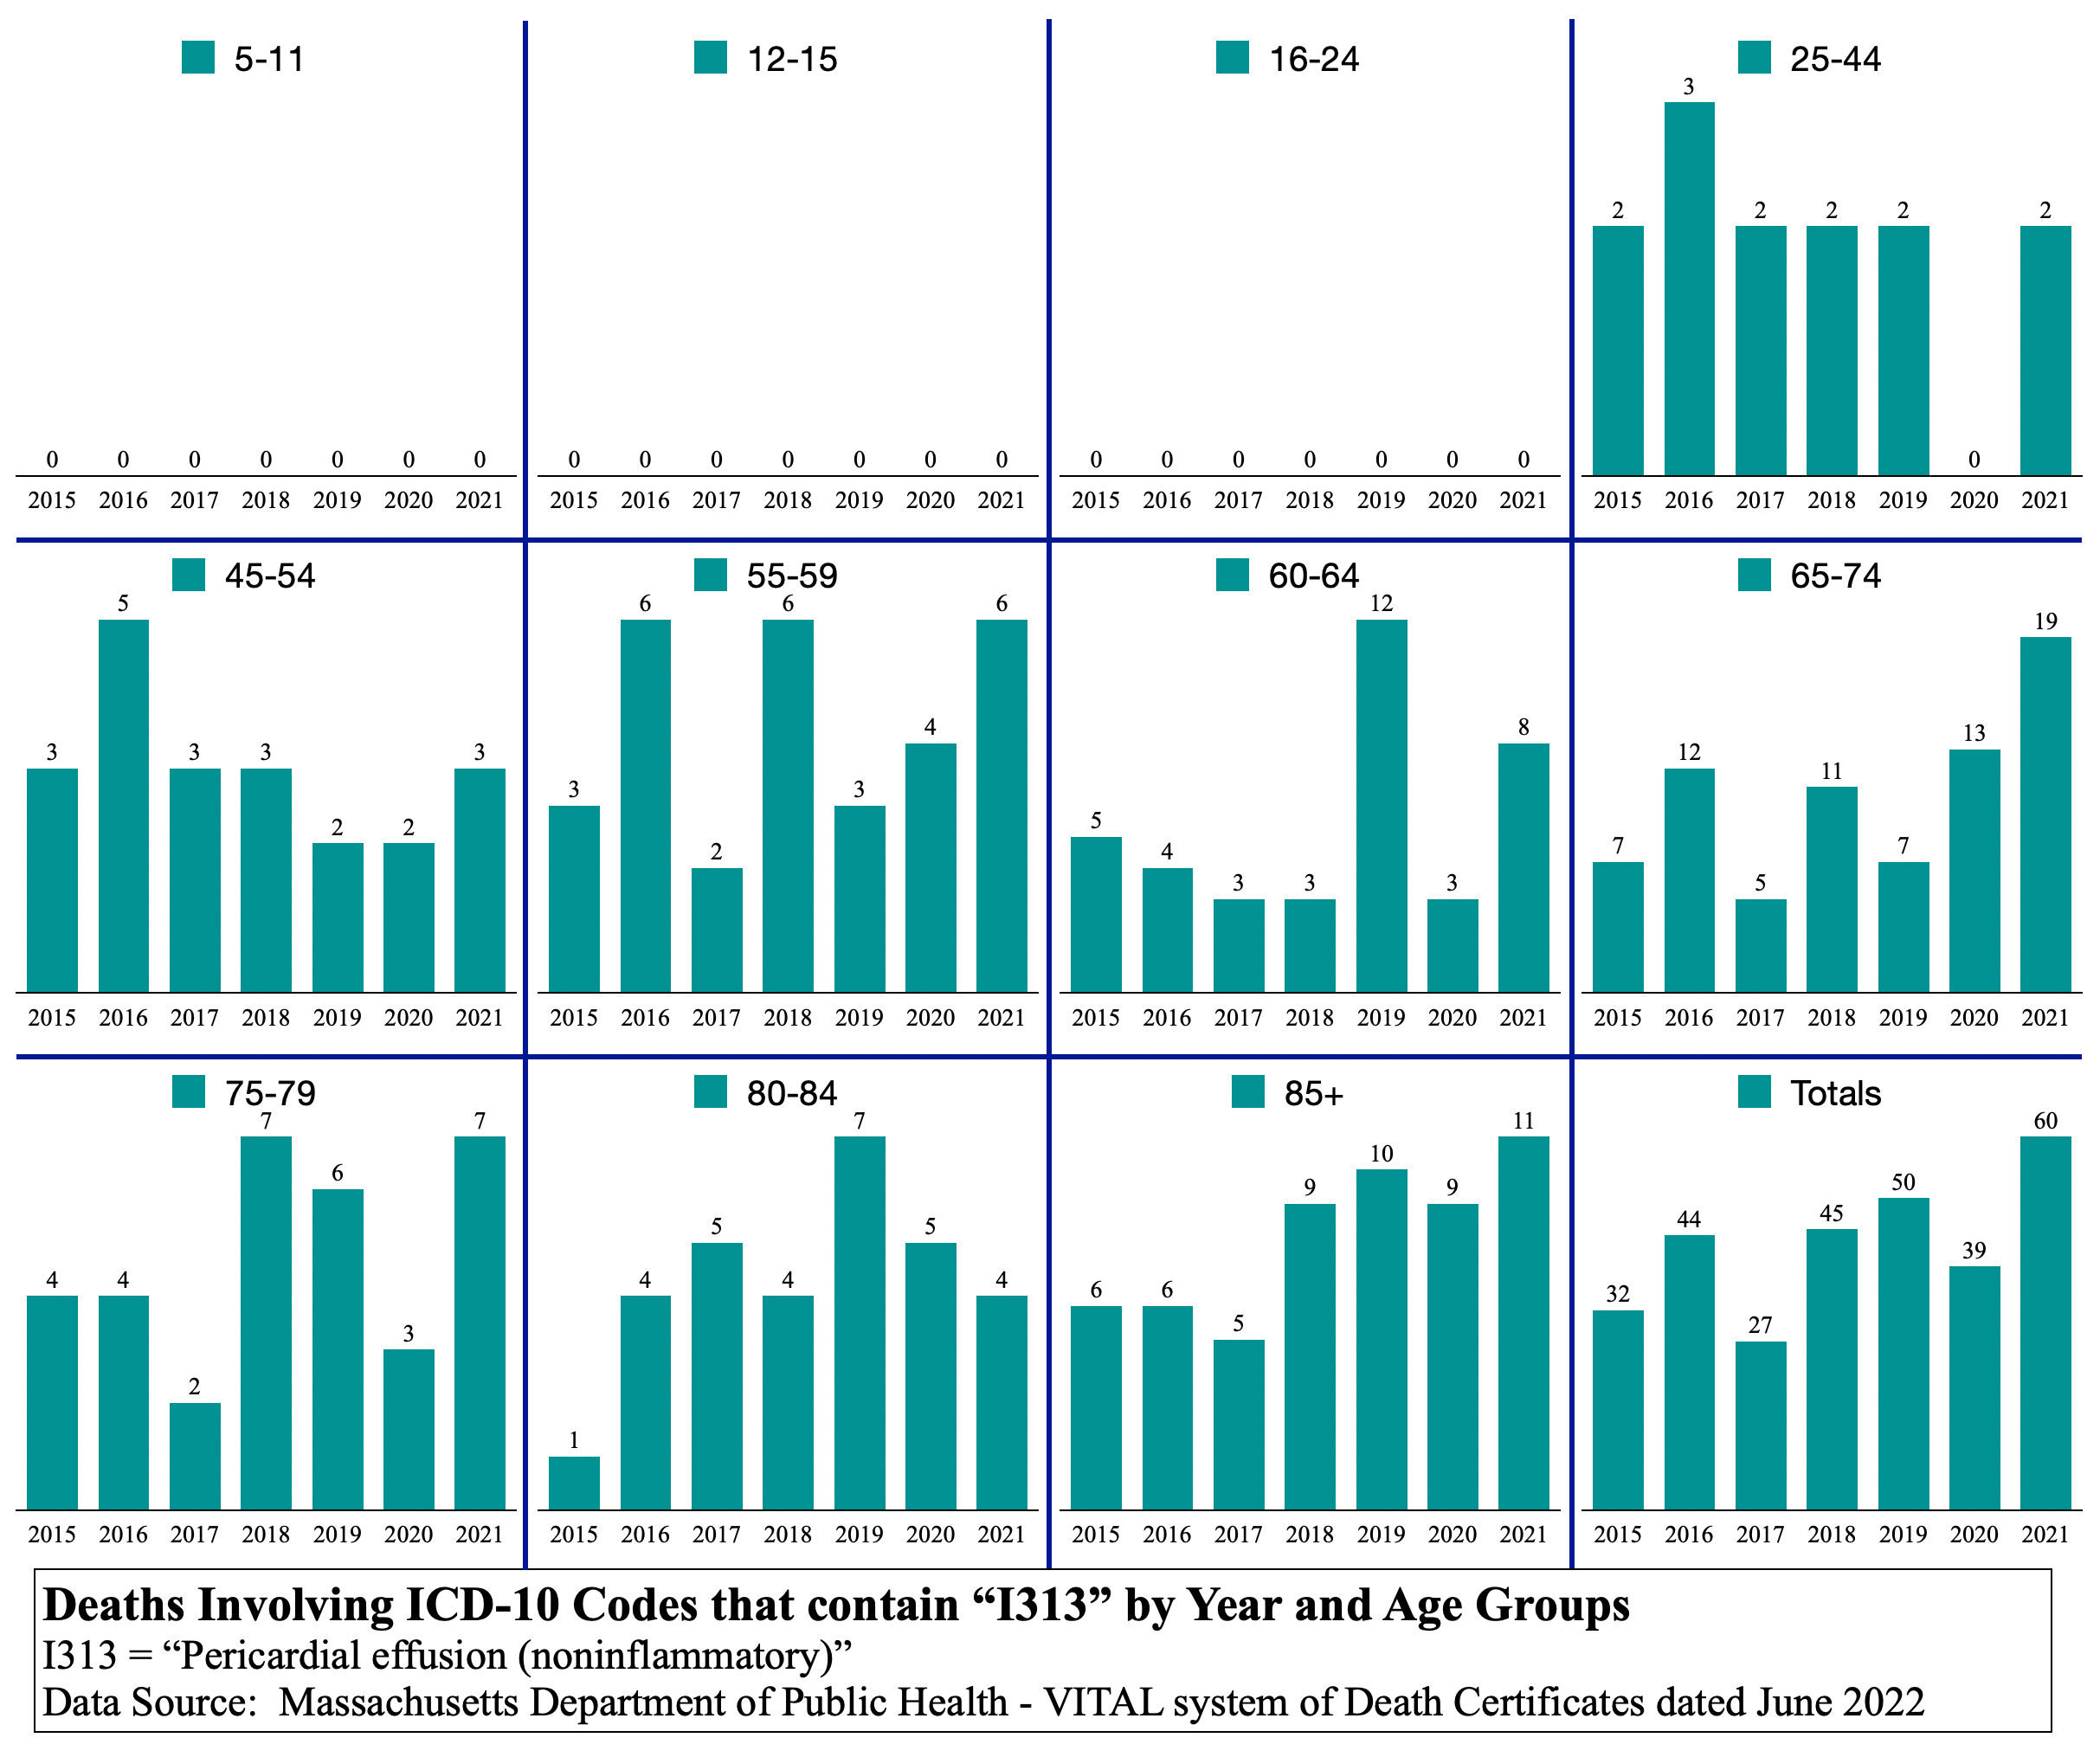
This age spectrum profile is disparate from the C19 graph set. They are not correlative. N179 is, therefore, not likely driven by C19 causally.
There is one thing certain in the N179 graphs. There is a major health emergency in Massachusetts in sudden kidney failure N179 related deaths and they should be investigated for causality.
This press release from the U.S. Food & Drug Administration (“FDA”), FDA’s approval of Veklury (remdesivir) for the treatment of COVID-19—the science of safety and effectiveness, can be found here. This release is dated 10/22/2020. Remdesivir was issued under the EUA in October 2020.
Is Remdesivir causally related to hundreds of N179 kidney failure deaths in Massachusetts?
An expanded semimonthly view of the 2020 and 2021 N179 deaths should be employed to see if Remdesivir approval and use correlates in time to this sharp rise in kidney failures in both years. The excess in both years sums to ~1,100 deaths involving acute renal failure. That’s a large number of excess deaths involving a single ICD-10 code.
N179 appears to be a killer all by itself. Is anyone at MA DPH looking into the cause of more than a thousand excess kidney failure deaths? What is the mission of MA DPH? Do they study any trend analyses? Surely, this is noticed as a major health emergency?
If you have a loved one who died in Massachusetts after October 2020 and the death certificate states “N179 Acute renal failure”, you should demand to know if and when Remdesivir was prescribed and if and when the C19 vaccine was administered.
State government, FDA, and pharmaceutical companies will not investigate this. They have abandoned The People and do not want to know the answer. It is now up to citizens to monitor these drugs. Physicians in Massachusetts will not likely go against anything the FDA says. Physicians are now robotically programmed to follow FDA and CDC guidance without question.
Safe medicine, informed consent, field knowledge, wisdom, and expertise are no longer prevalent. One young physician noted to this author that he had to leave Massachusetts because he could not ethically treat people the way hospital administrators demanded during the C19 era. He said that they threw the treatment book out the window and followed some other source of orders when C19 hit Massachusetts in March 2020.
Symptom spectrum profile disparity
In C19 vaccine - the cause of causes, it was shown that there was a relative switchover in causes of death from respiratory pneumonia-like illnesses in 2020 to circulatory system heart attacks, clots, strokes, and vessel internal injury deaths in 2021. While both types of deaths were greater in both years 2020 and 2021, the relative differences between the two flipped from year to year. Since diseases do not generally drastically change their symptoms on year boundaries, one can theorize that something totally different from C19 is causing the circulatory system internal injuries leading to death in 2021. This shows disparity in symptom spectrum profile between C19 and whatever caused internal injury deaths in 2021.
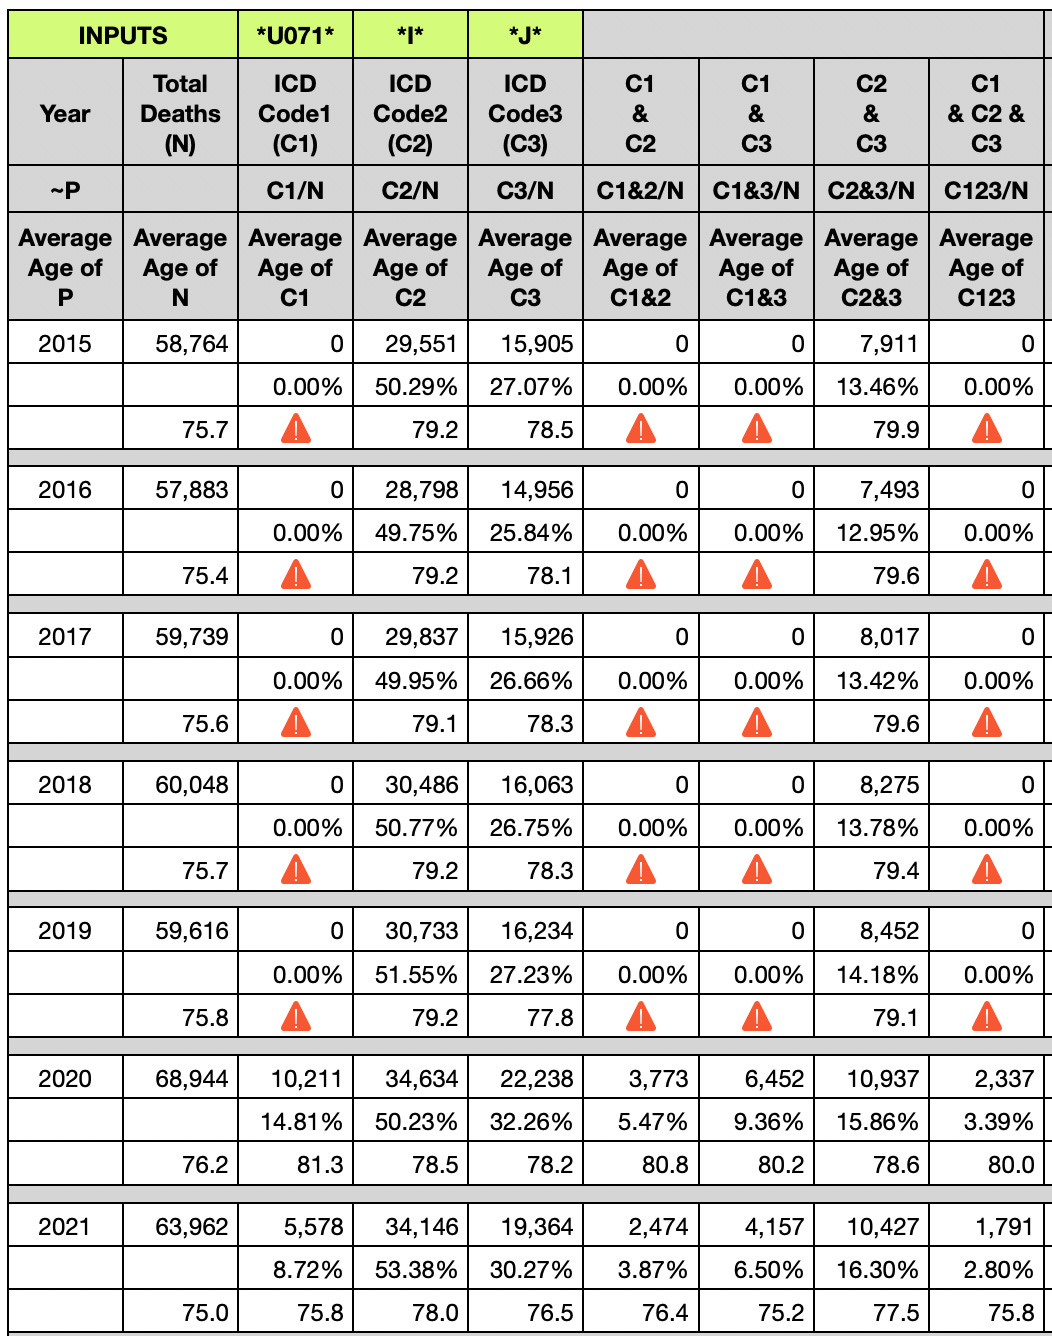
In the table above, focus now on the percentage of total deaths in a year that a cause of death comprises. For example, in the year 2020, 10,211 covid-involved (U071) deaths comprise 14.81% of all deaths 68,944. Compare that to 2021 in which 5,578 covid-involved (U071) deaths comprise only 8.72% of all deaths 63,962.
Looking at “I” codes, they went from 50.23% in 2020 to 53.38% in 2021. That seems odd. While U071 had a 41.1% reduction year over year ( [14.81% - 8.72%] ÷ 14.81% ), “I” codes had a 6.3% increase year over year ( [53.38% ÷ 50.23%] - 1). If “I” codes were causally related to C19, one would expect them to be directly proportional in rate change year over year (expected to go down, not up as they did).
In 2020, C19 was known to be a respiratory virus causing respiratory pneumonia-like illness and death. “J” codes should, therefore, be directly proportional to C19 rate change in deaths. Looking at “J” codes, they went from 32.26% in 2020 to 30.27% in 2021. While, year over year, U071 decreased 41.1% reduction and “I” codes increased 6.3%, “J” codes decreased 6.2% ( [32.26% - 30.27%] ÷ 32.26% ).
Although the relative reductions of 41.1% and 6.2% are quite disparate in amplitude, they are both reductions, nonetheless, which implies there may be a correlation. Or there may be fraud confounding the amplitude from being strongly correlative. Nonetheless, “J” codes are going the same direction as U071 C19, not opposite direction like “I” codes.
Regarding the age spectrum profile of C19, notice that the average age of C19 death in 2020 was 81.3yo. Look at 2021. It went down to 75.8yo. Is this even the same disease year over year? Or is there so much fraud that the age spectrum profile drasticaly changed year over year?
For data hounds, scientists, and other math-oriented people, this table affords you the opportunity to mix and match analyses of multiple causes and sets. For example, if you want to know the percent increase of C19 deaths that also included both an “I” code and a “J” code, you can use C123 ÷ C1 for 2020 and compare it to the same for 2021. The answer is that 2020 is 22.9% and 2021 is 32.1%. That’s a 40.2% annual increase and that’s quite shocking. What it means is left to the interpreter of the data. The symptom spectrum profile is very disparate year over year.
This table alone has a large number of permutations that can be measured for change, rate of change, and excess deaths across variables: total deaths, C19 deaths, “I” code deaths, and “J” code deaths.
IMPORTANT
The symptom spectrum profiles of causes of death in the context of a C19-labeled death is shown to change by 40% year over year. The age spectrum profiles are also shown to drastically change year over year. These two alone should alarm anyone who understands disease profiles. Diseases do not just change in age spectrum profile, symptom spectrum profile, and seasonal trigger profile by such large degrees at a year’s boundary. Scientists have been chasing fraudulent data for nearly two years now.
A term coined by the CIA decades ago to discredit, in the minds of the public, a plausible theory supported by evidence is “conspiracy theory.” The conspiracy theory that C19 is not much more than a bad flu year is looking more and more plausible and supported by evidence.
If the vaccination dates are somehow attained by data researchers, then correlation of C19 vaccines to deaths can more easily be made. This would enable correction of fraudulent records. Correction of fraudulent records would decrease the C19 death totals and increase the C19 vaccine adverse event totals, including deaths. But alas, the State of Massachusetts denied that Public Records Request for C19 vaccine dates of two specific decedents on grounds that it is private information of the decedent. I suppose we aren’t allowed to know for certain in a public record that the decedent became ill within minutes of the C19 vaccine and died soon after, but were labeled as C19 deaths with no causal attribution or mention of the C19 vaccine on the death certificate. If all the death certificates were corrected to reflect only actual “causes” of death, C19 could end up with real death counts not much higher than a bad influenza year. And C19 vaccine deaths could end up greater than C19 deaths, a near certainty in anyone aged 60 or younger.
“I” Codes age spectrum profile
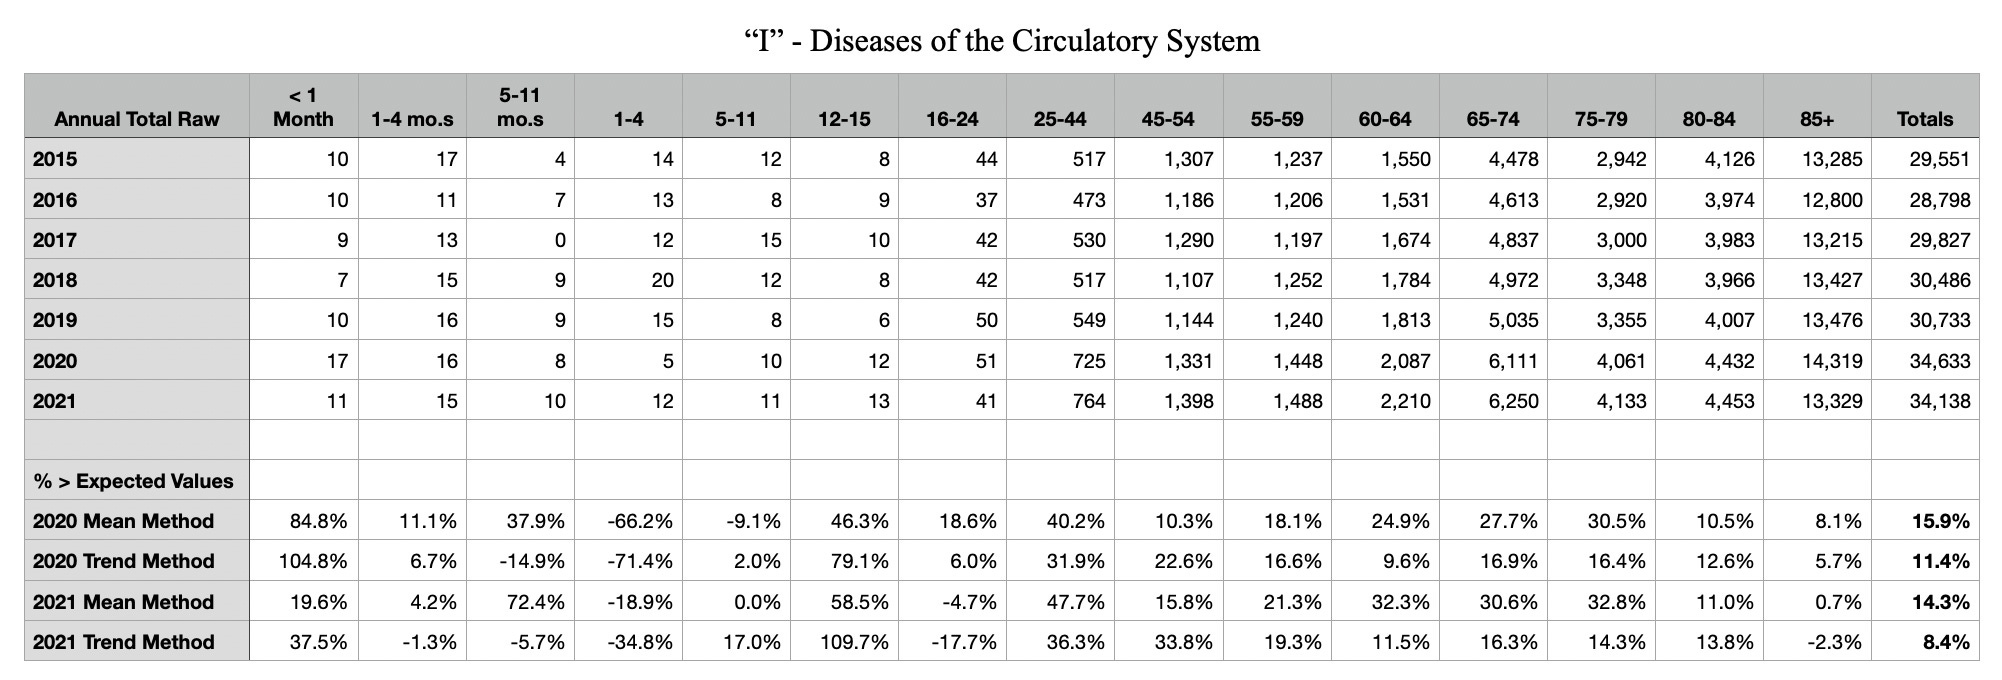

The questions that may never be answered regarding the above table and graph set are:
Did C19 cause “I” code circulatory system issues resulting in deaths in 2020, which are much higher than 2015 through 2019?
OR
Were “I” code circulatory system deaths fraudulently labeled C19 deaths also to get the C19 numbers up and reap the cash from federal relief money to the hospitals?
OR
Were there “I” code clot deaths occurring in 2020 because care facilities stopped walking elderly patients a few hundred feet each day as part of a routine because of government recommended C19 restrictions on movement? Sit around, clot, and die. Whereas 2021 is possibly because of the C19 vaccine?
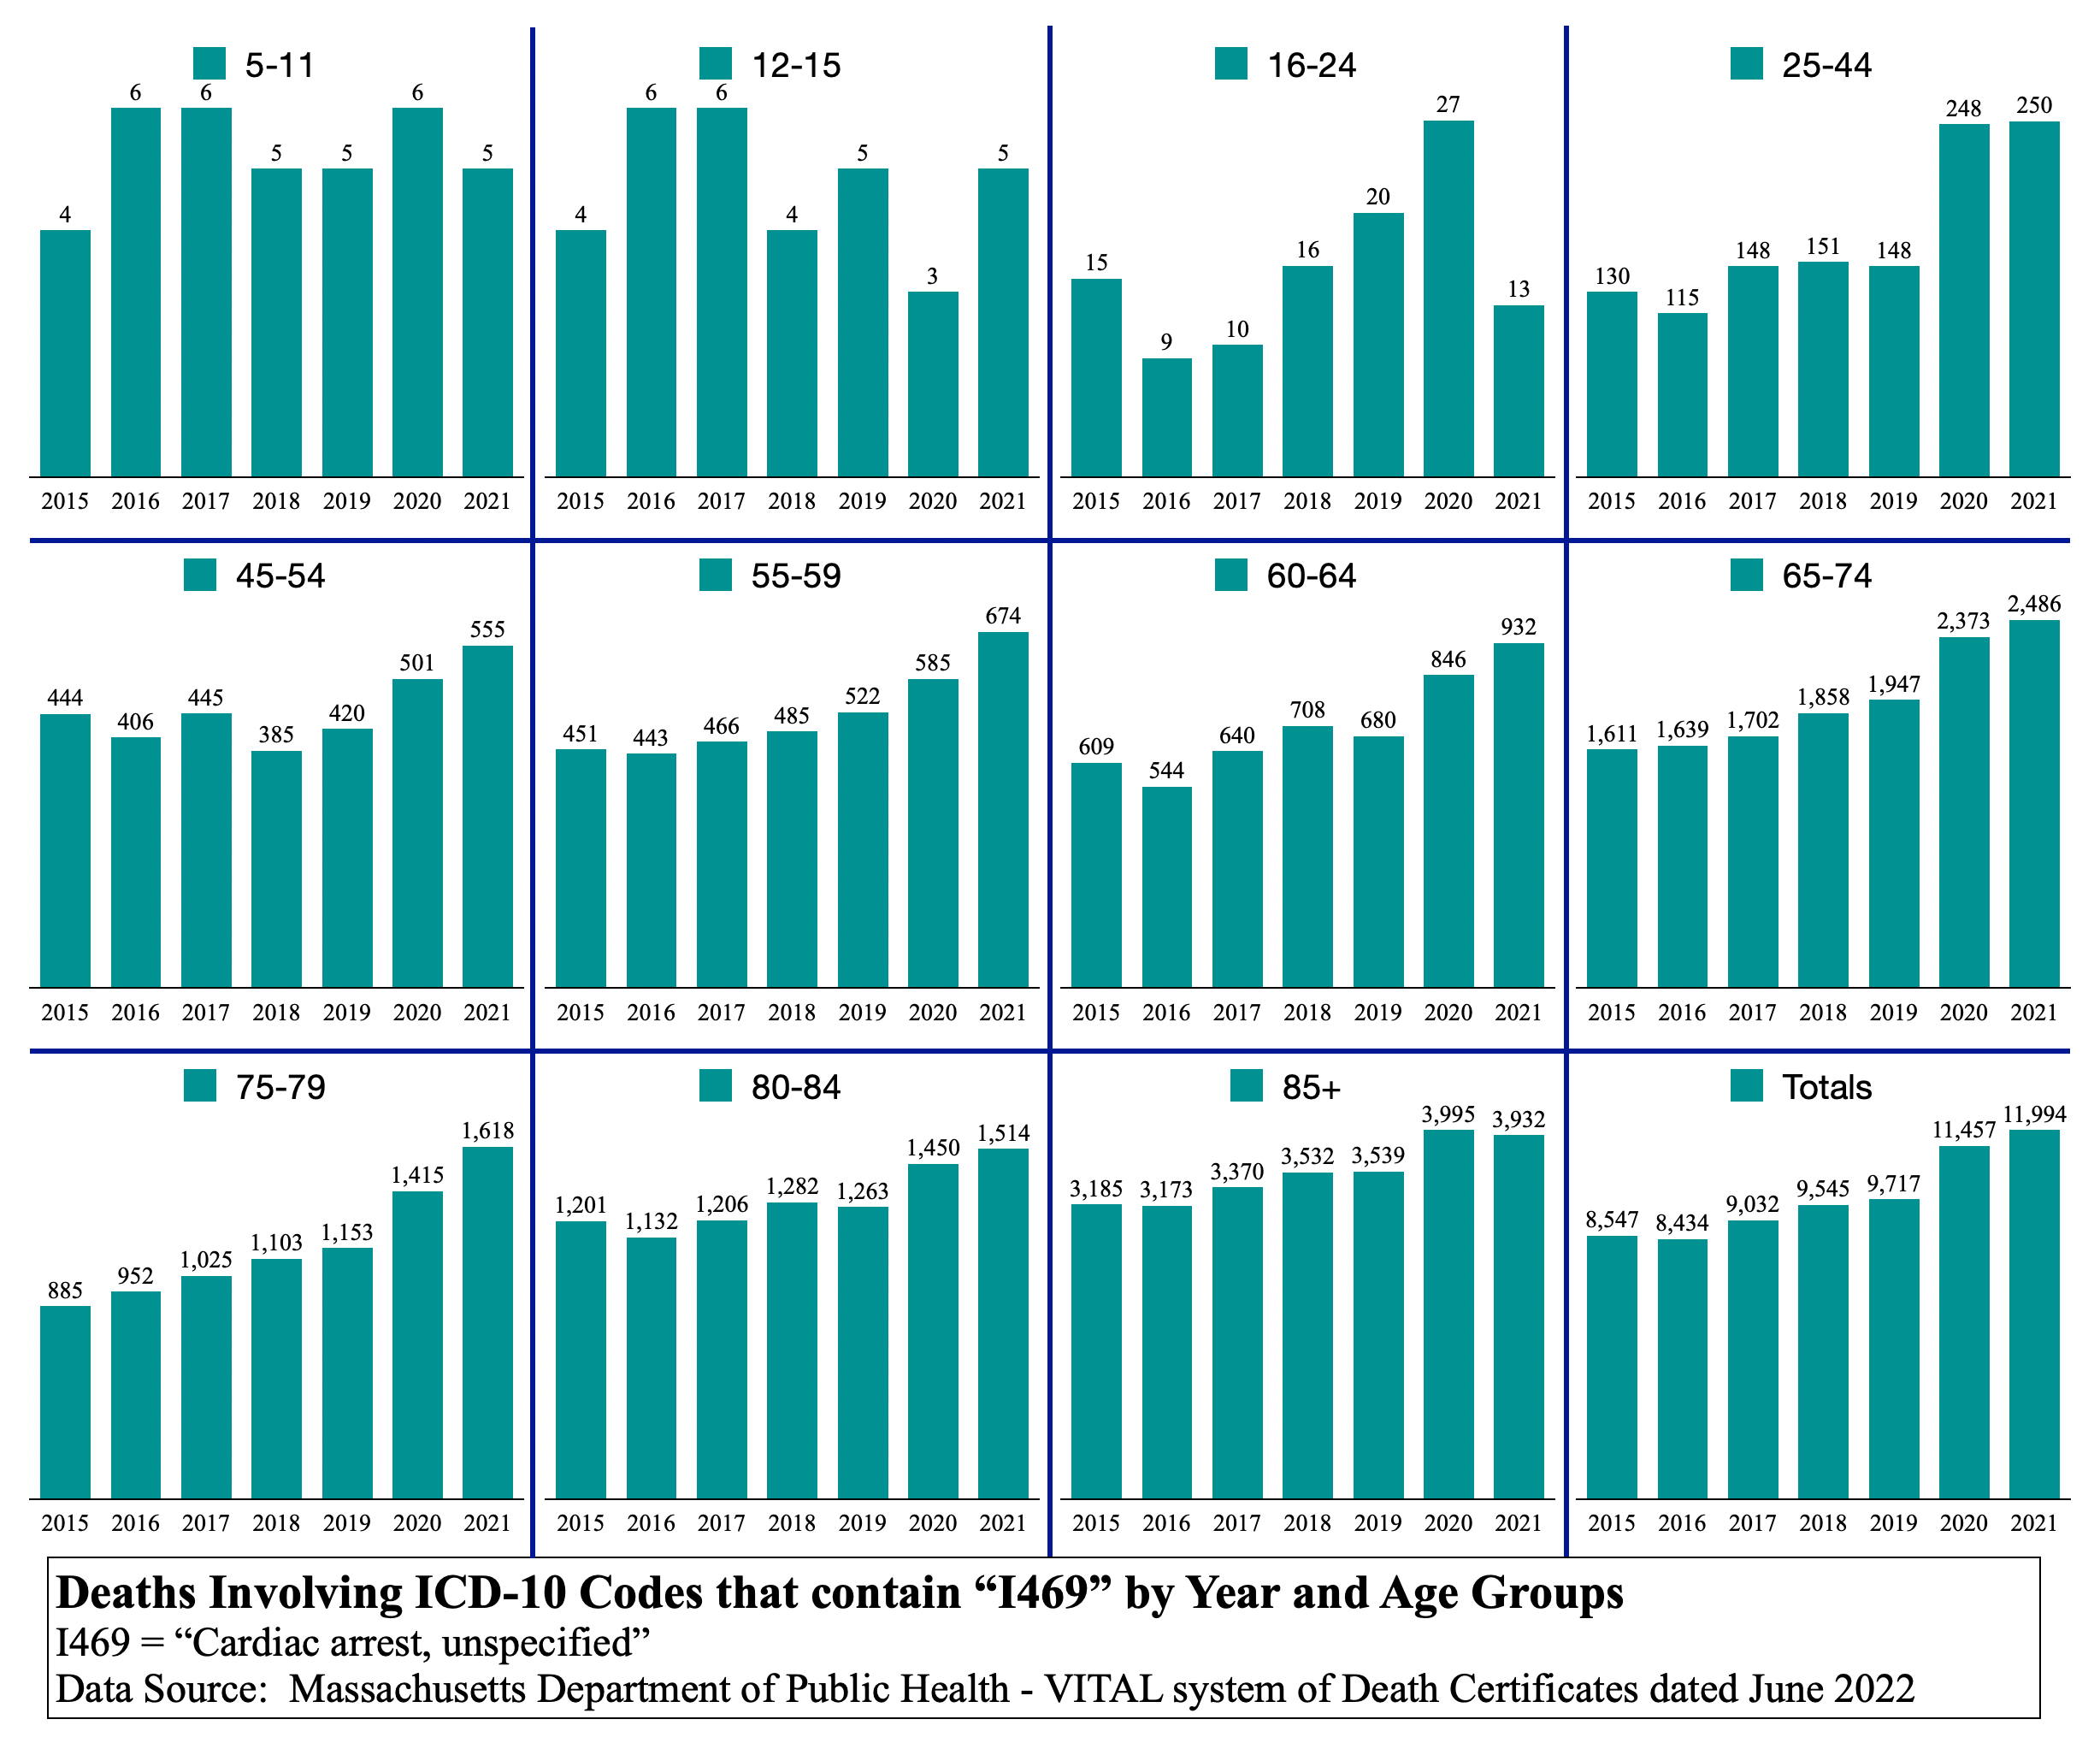
After age group 16-24, 2021 “I” code deaths are higher in all but the 85+ age group. This is more consistent with N179 than with C19 and all-cause. id est, “I” codes and C19 are disparate in age and symptom spectrum profiles. Let’s now compare to the symptom spectrum profile of “J” codes.
“J” Codes age spectrum profile
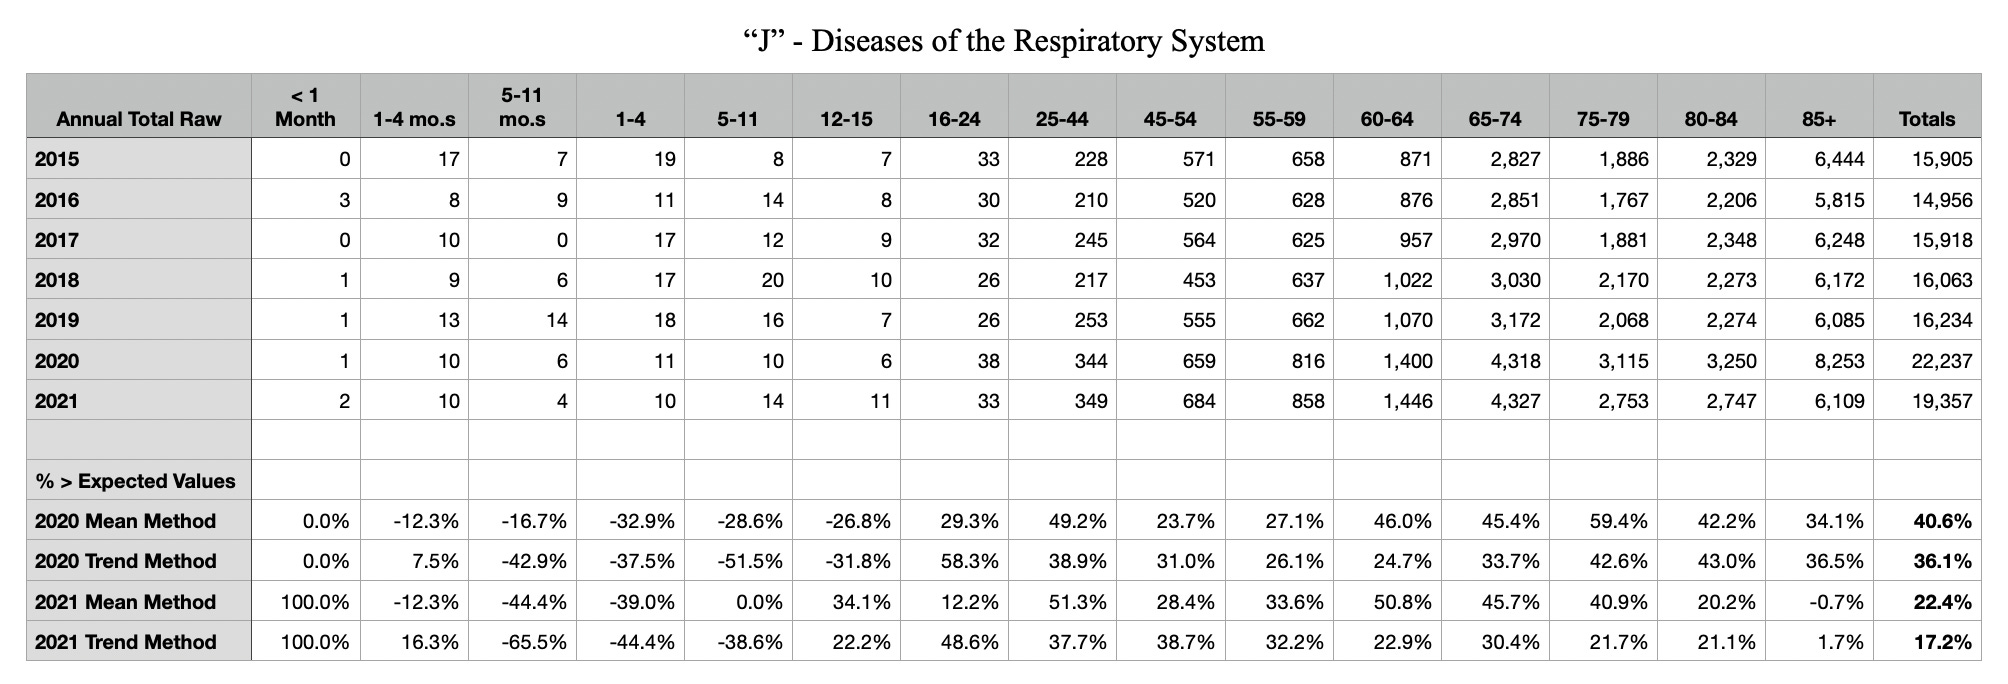
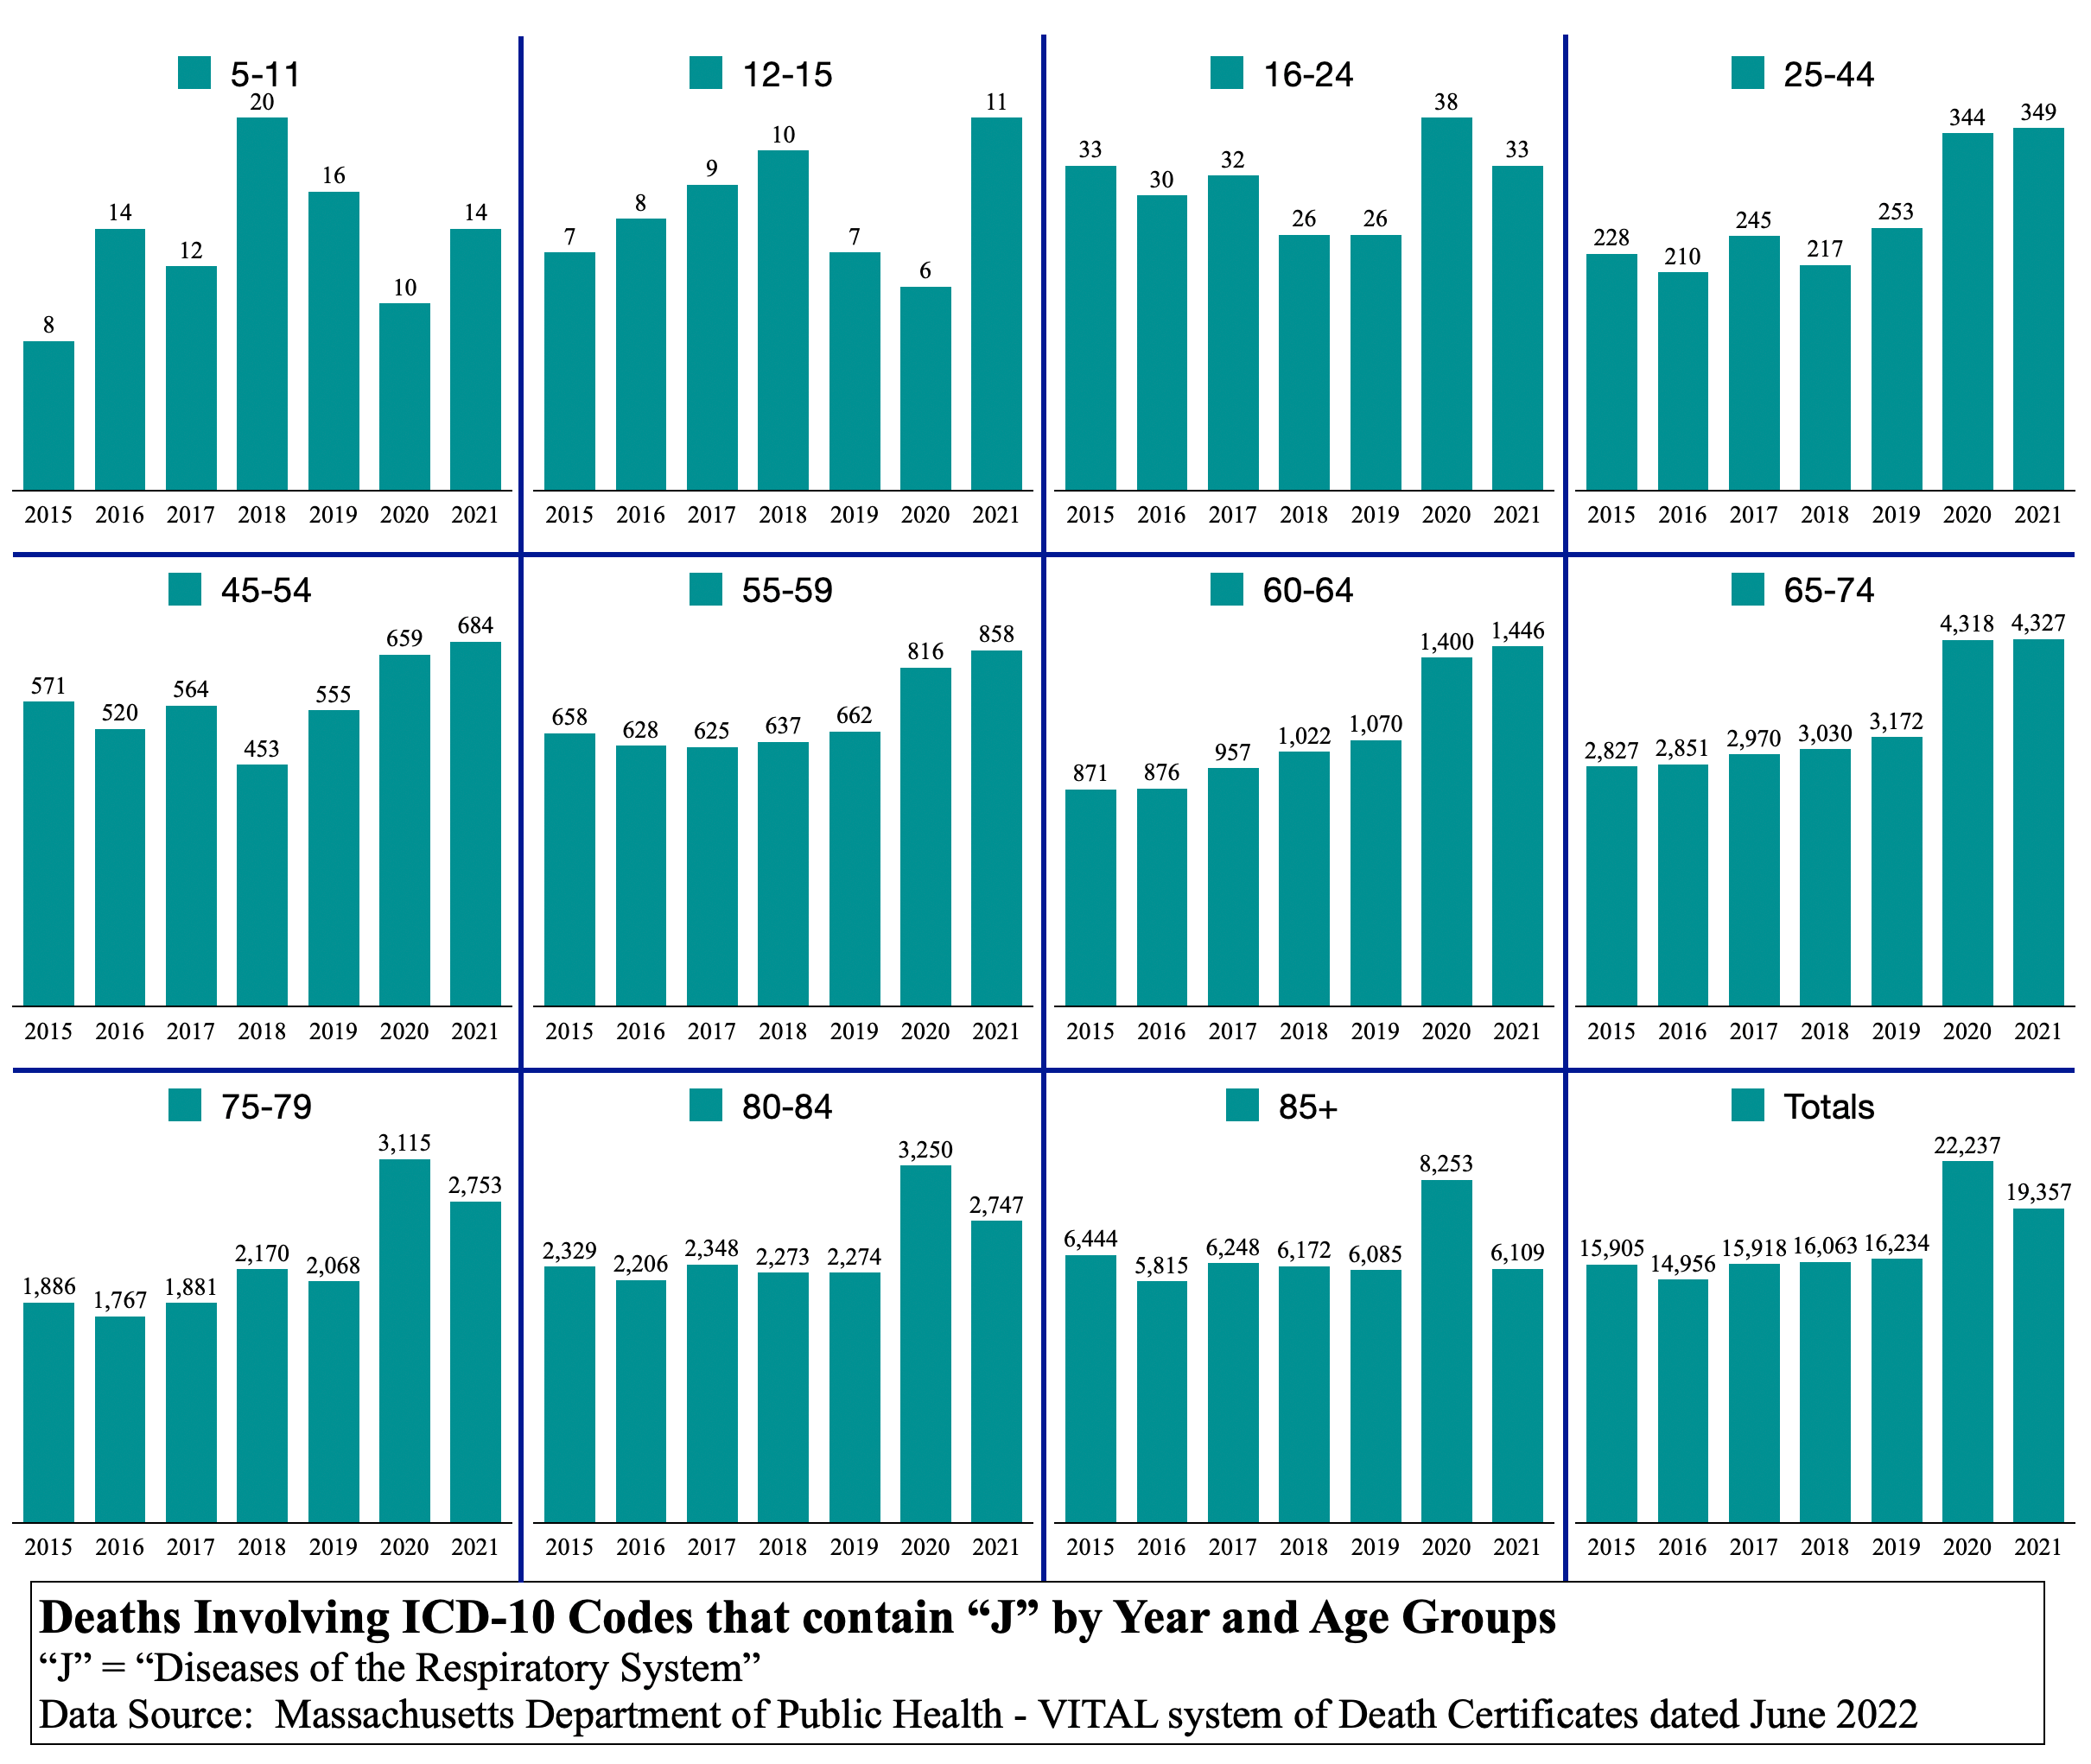
“J” code graphs do not resemble the relative differences that “I” code graphs do. After 16-24 age group, 2021 is higher until the switchover at around 65-74 age group. This resembles the C19 and all-cause graph sets and not N179 or “I” codes as one would expect. It is plausible that “J” codes and C19 are causally linked.
If C19 is not killing people by N179 or “I” codes, which include internal injuries manifesting in heart attacks, clots, and strokes, then why are there so many more deaths of N179 and “I” codes in 2021? Something else must be killing them. But what? Remdesivir, C19 vaccine, masks, lockdowns, decreased mobility, poor diet?
What the hell happened to our institutions that are supposed to be investigating real causes of death and maim? Why are they shoving recommendations and drugs and needles at us for something that barely still exists, while those same recommendations and drugs and needles might be the causes of real death and maim through internal injuries to our circulatory systems (clots, strokes, heart attacks, myocarditis, pulmonary emboli, thrombocytopenia, disseminated intravascular coagulation, portal vein thrombosis, liver function impairment, kidney failure …)
Conclusion
From all the data gathered and analyzed thus far regarding fraudulent records, implausible data profiles, prevarications regarding C19 vaccines, and possible deaths by Remdesivir, the conspiracy theory side is on a solid foundation of truth and reality. Those who name-call using the CIA-coined term “conspiracy theorist” have not been right about anything including natural immunity, sterilizing effect of C19 vaccination, effectiveness of C19 vaccination, and now, safety of C19 vaccination. Their track record is a null set. They have not won a single battle of truth yet.
At this point, one can envision a world in which the government did not take advantage of C19 to thrust a Great Reset against the economies and free peoples of the United States and the world. Imagine if there was no hype on television news, no six feet, no masking, no arrows on floors, no plexiglass everywhere. Imagine schools were not canceled, bars were not closed, and life just went on as normal without the constant drumbeat of “be afraid, be afraid, be afraid” to control people.
How many people do you know who died from actual C19 in 2020? The year 2021 is confounded with the C19 vaccine. If you know someone who is purported to have died from C19 in 2021, you should wonder what the vaccination status of that person was at time of death.
Even in Massachusetts, one of the supposedly hardest hit C19 places in the entire world, there were few deaths outside care homes. Few deaths were reported in anyone under age 60 years. Something is terribly amiss in this entire situation. The public may never get an answer. However, the shots must stop and the Great Reset and Agenda 2030 must be sent to the trash heap of socialist revolutions against free peoples. There are many examples of trash heap residents because, in the end, socialism always fails against liberty. Ask those who fled the National Socialist Workers Party in Germany or the Soviet Communist Party or the Chinese Communist Party. Ask how Venezuela is doing since Chavez began his takeover and hand-off to Maduro. Ask Cubans in Florida why they’re in Florida when Cuba was such a thriving island nation for so long before Castro. Now look on the streets of San Francisco and Los Angleles to see the promise of socialism realized. How many people are fleeing?
Wake up … please. C19 is a man-made respiratory disease, but the human immune system handled it as it does all diseases … very well. The government’s responses killed so many people and drove society into unnecessary fear.
If you don’t believe yet that excess deaths in 2021 are mostly unrelated to C19 and rather are related to something government did, then look at most of the graphs below in addition to the ones above. Why is 2021 higher in most?
The commentary hereinafter will be very short, if any at all. The tables and graphs are presented here for use by researchers. If any scientist needs to replicate the sourcing of this data, figure out how to reach me. People know who I am. Or perhaps you have a specific request to run a few codes against each other in permutations.
Lastly, keep in mind, when looking at these graphs, that C19 deaths were halved from 2020 to 2021. So any graphs that shows deaths greater in 2021 than 2020 must be caused by something else, whether C19 vaccine, sitting around sedentary, or other root government intervention cause.
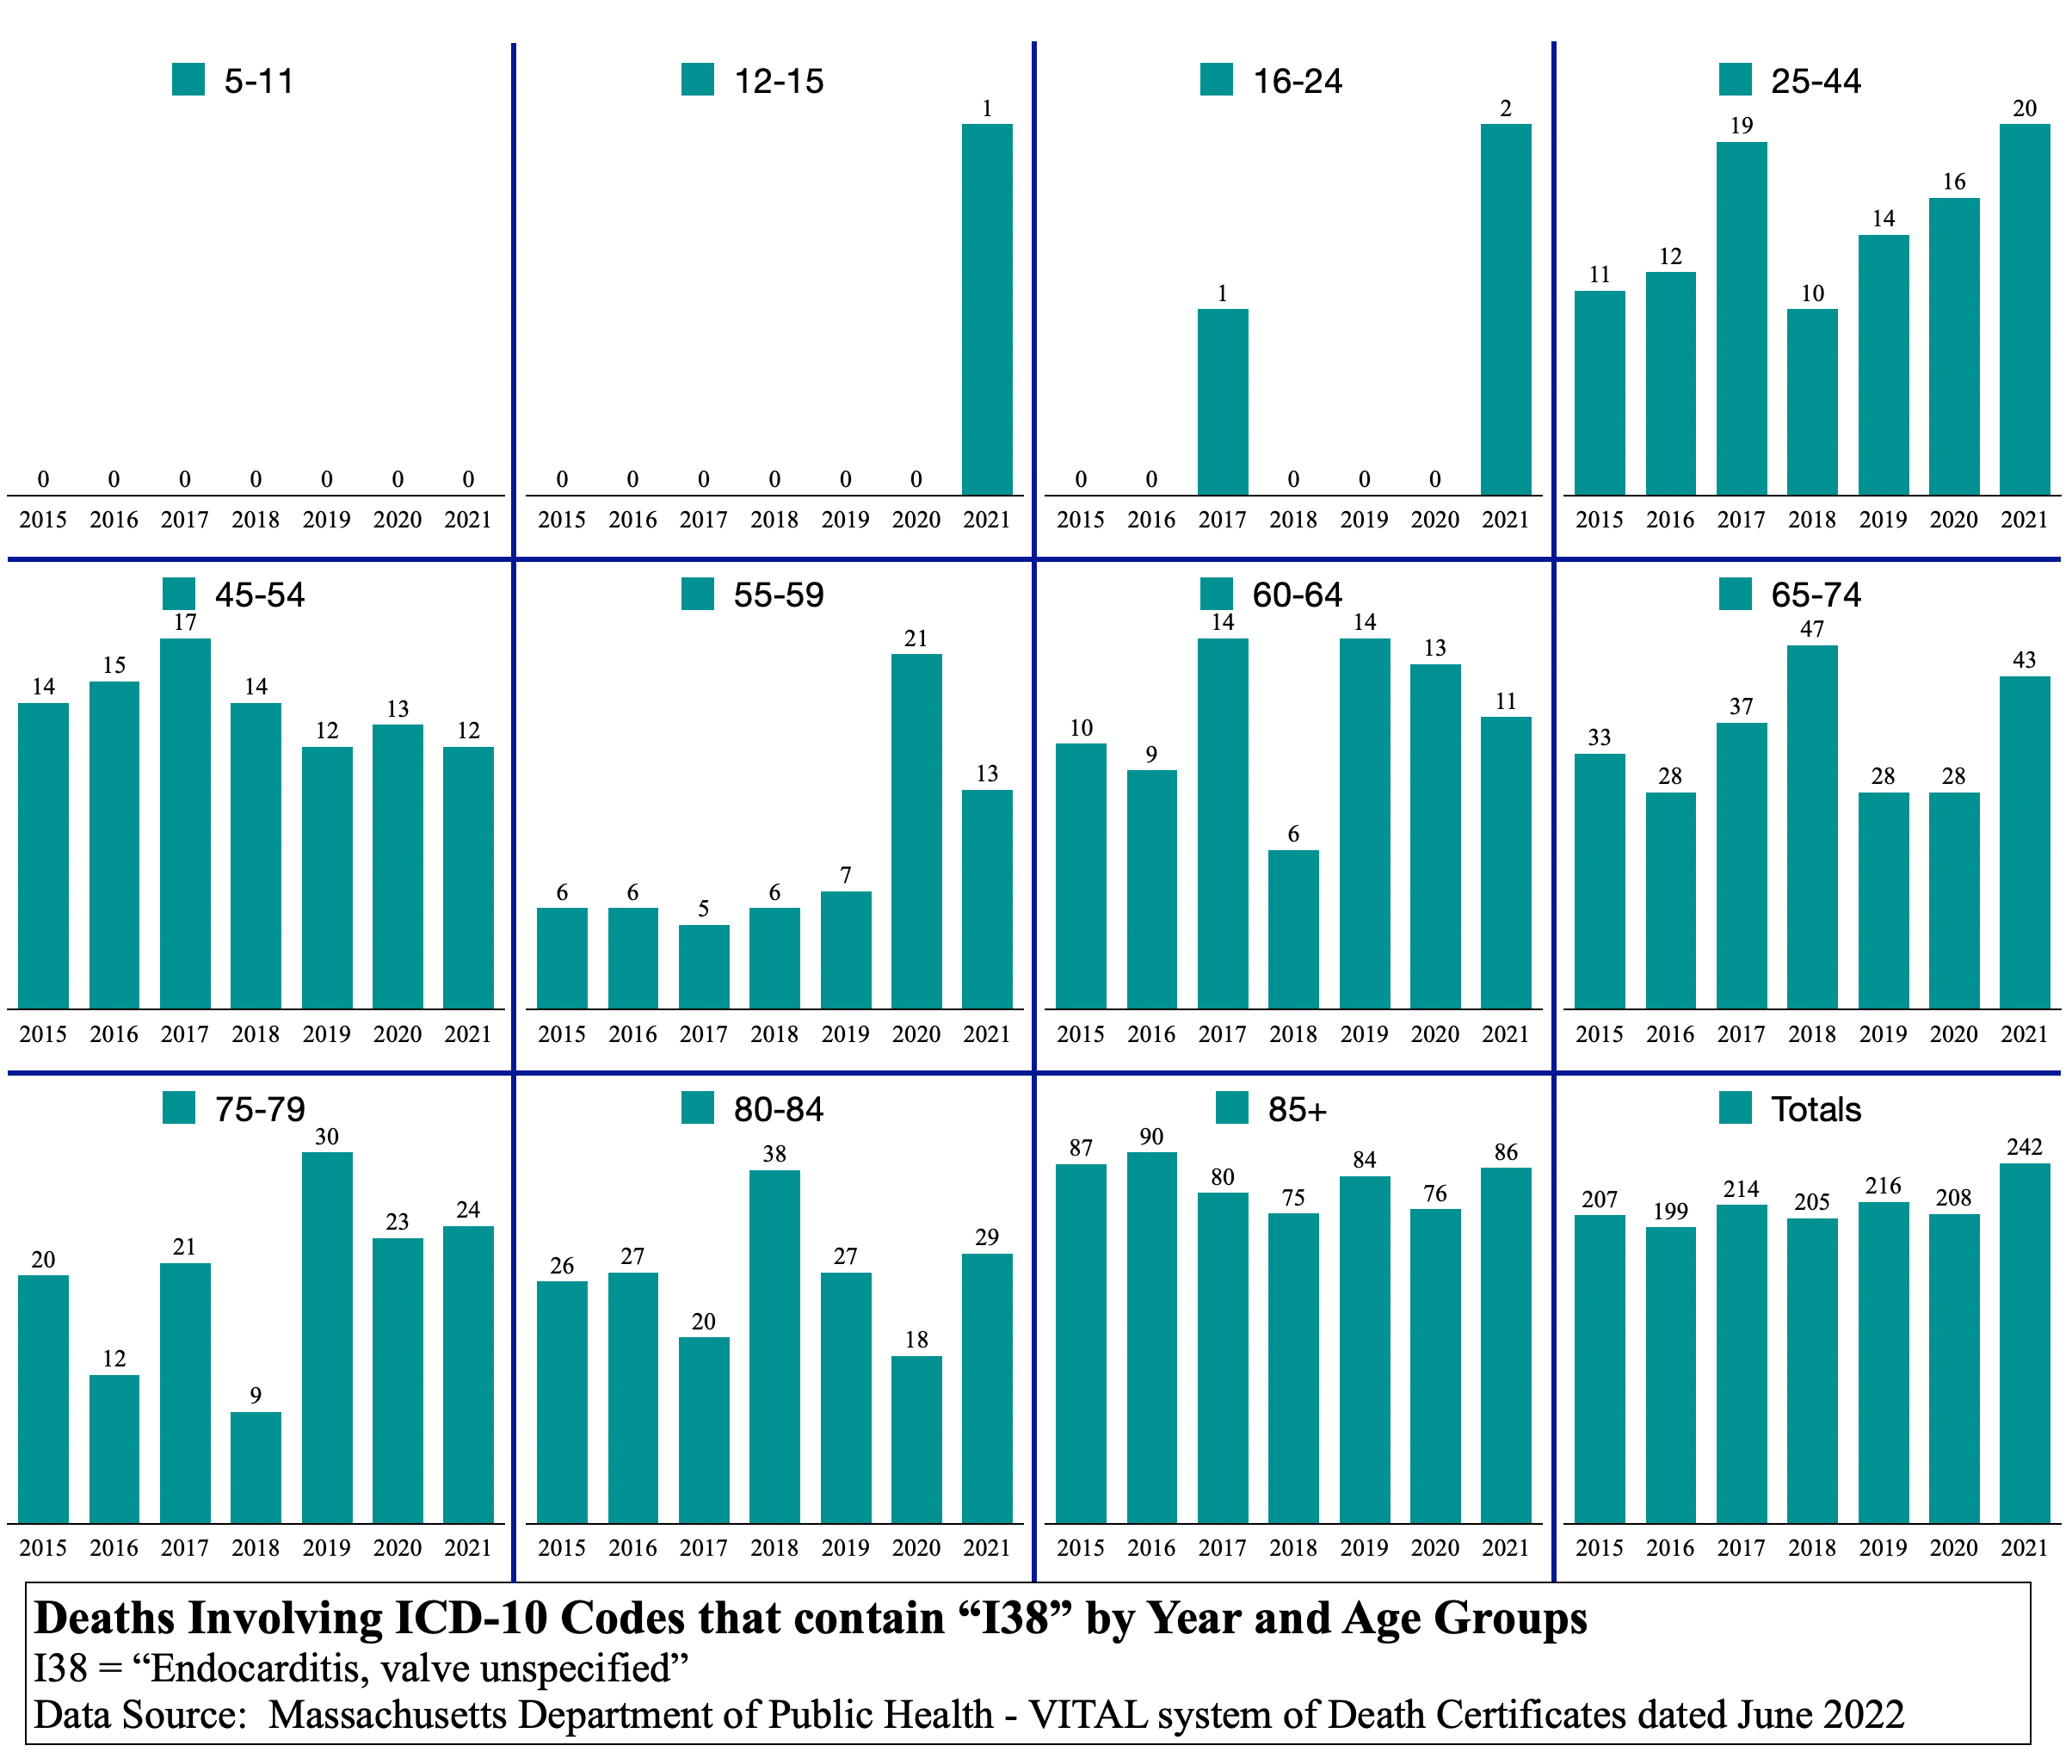
I38 Endocarditis
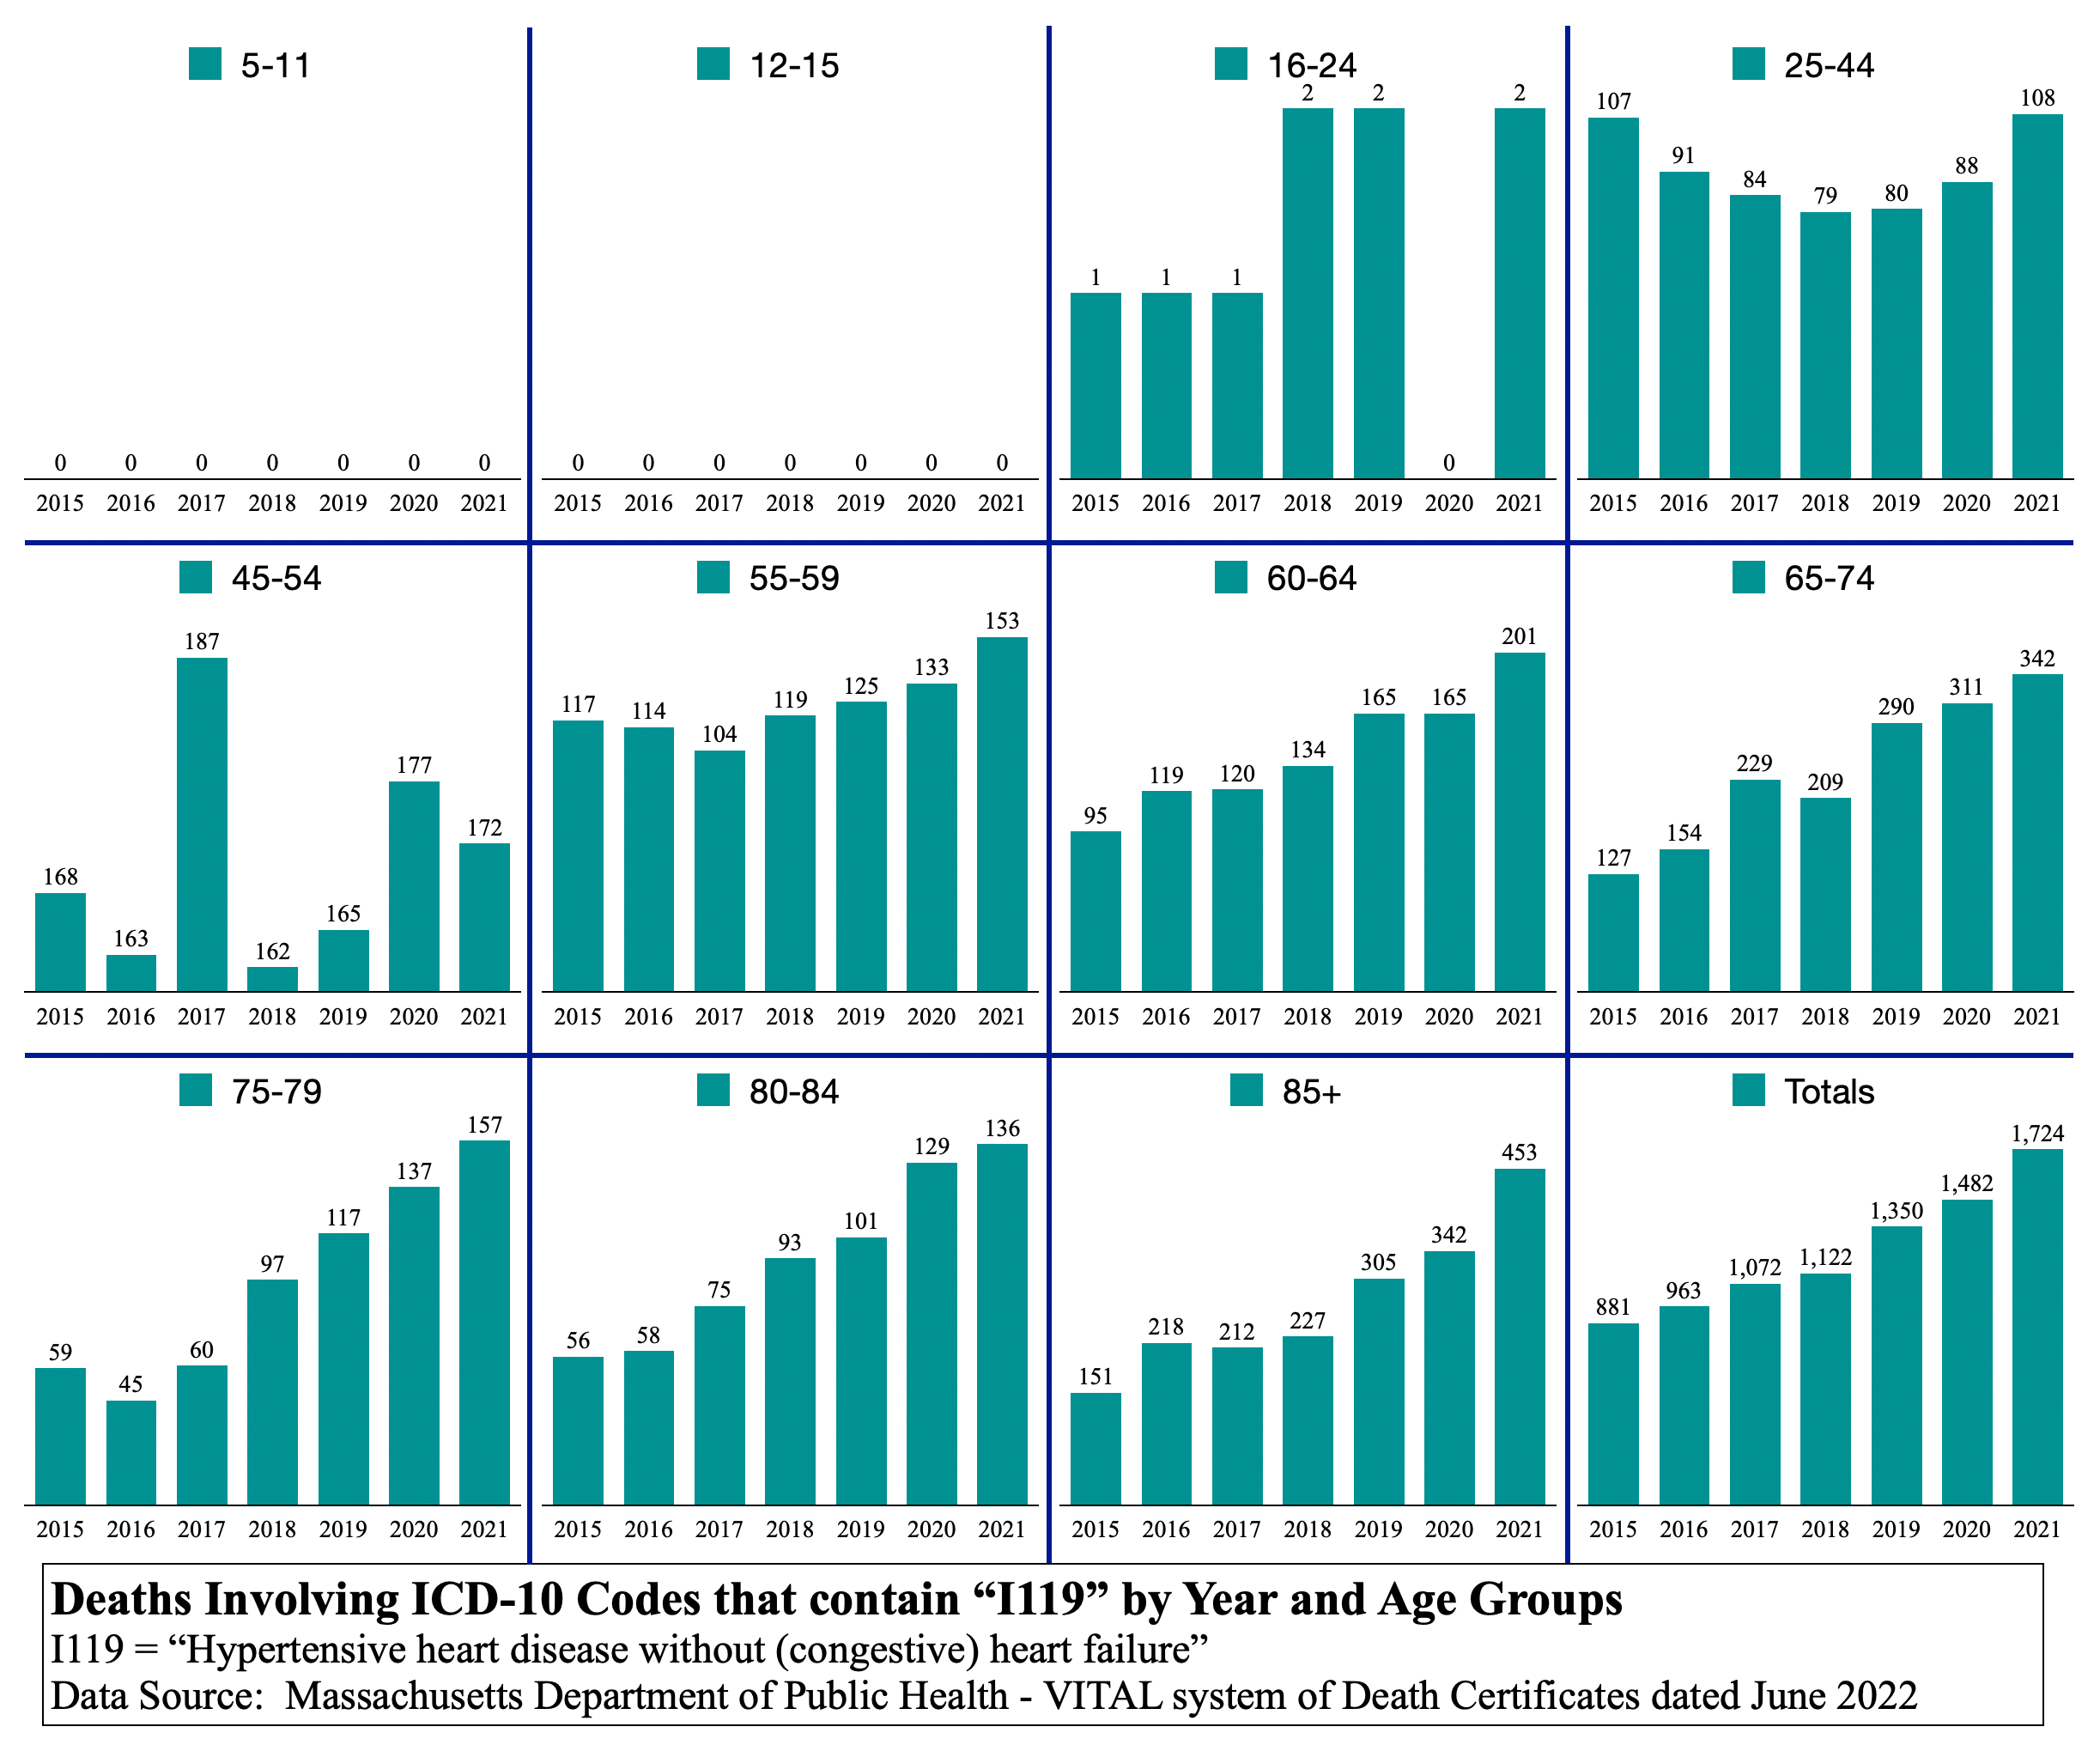
I119 Hypertensive heart disease
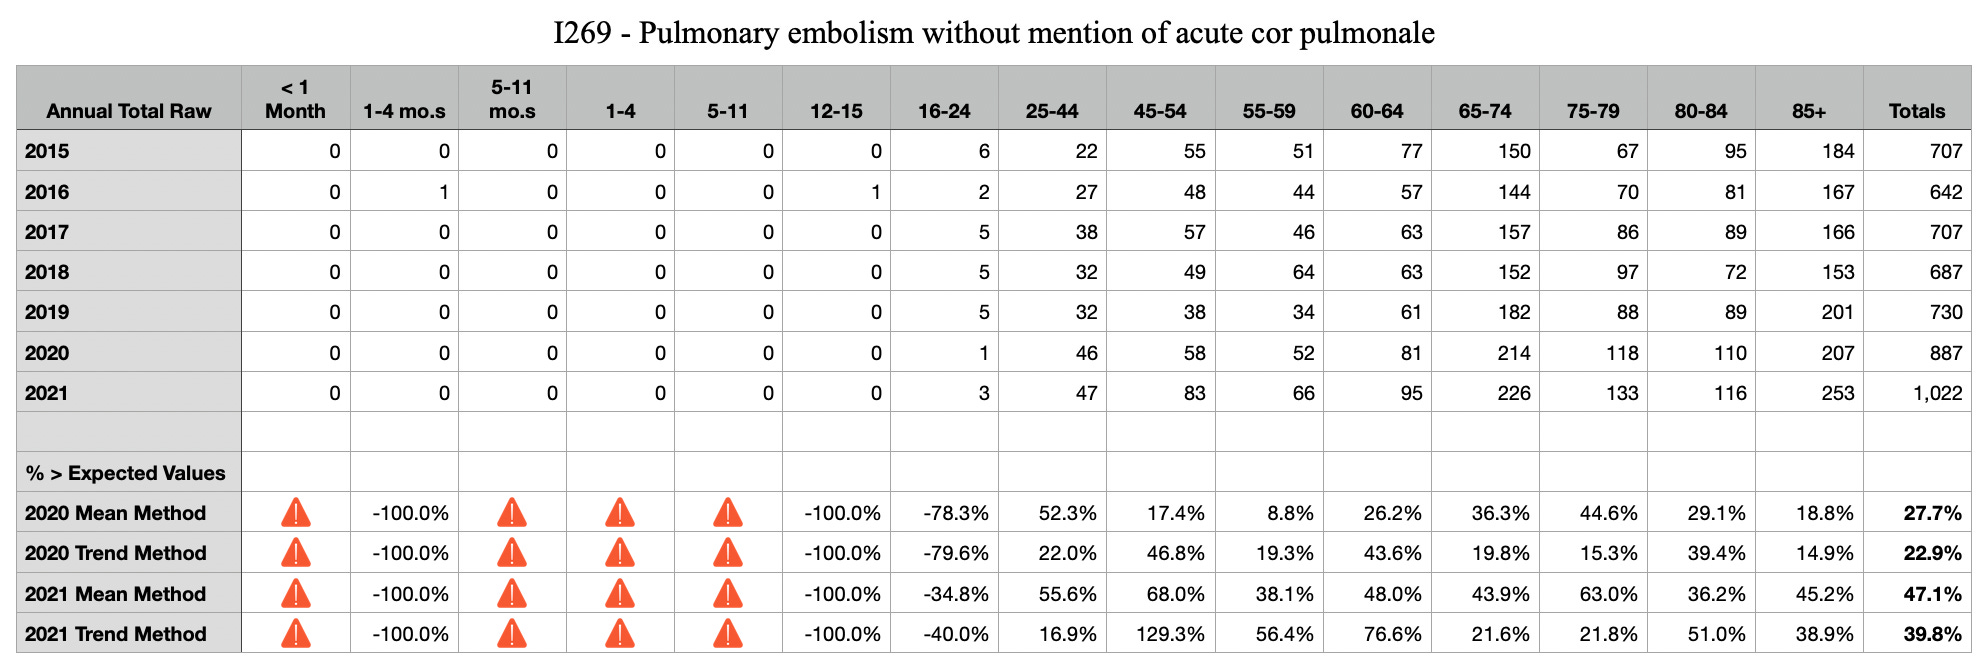
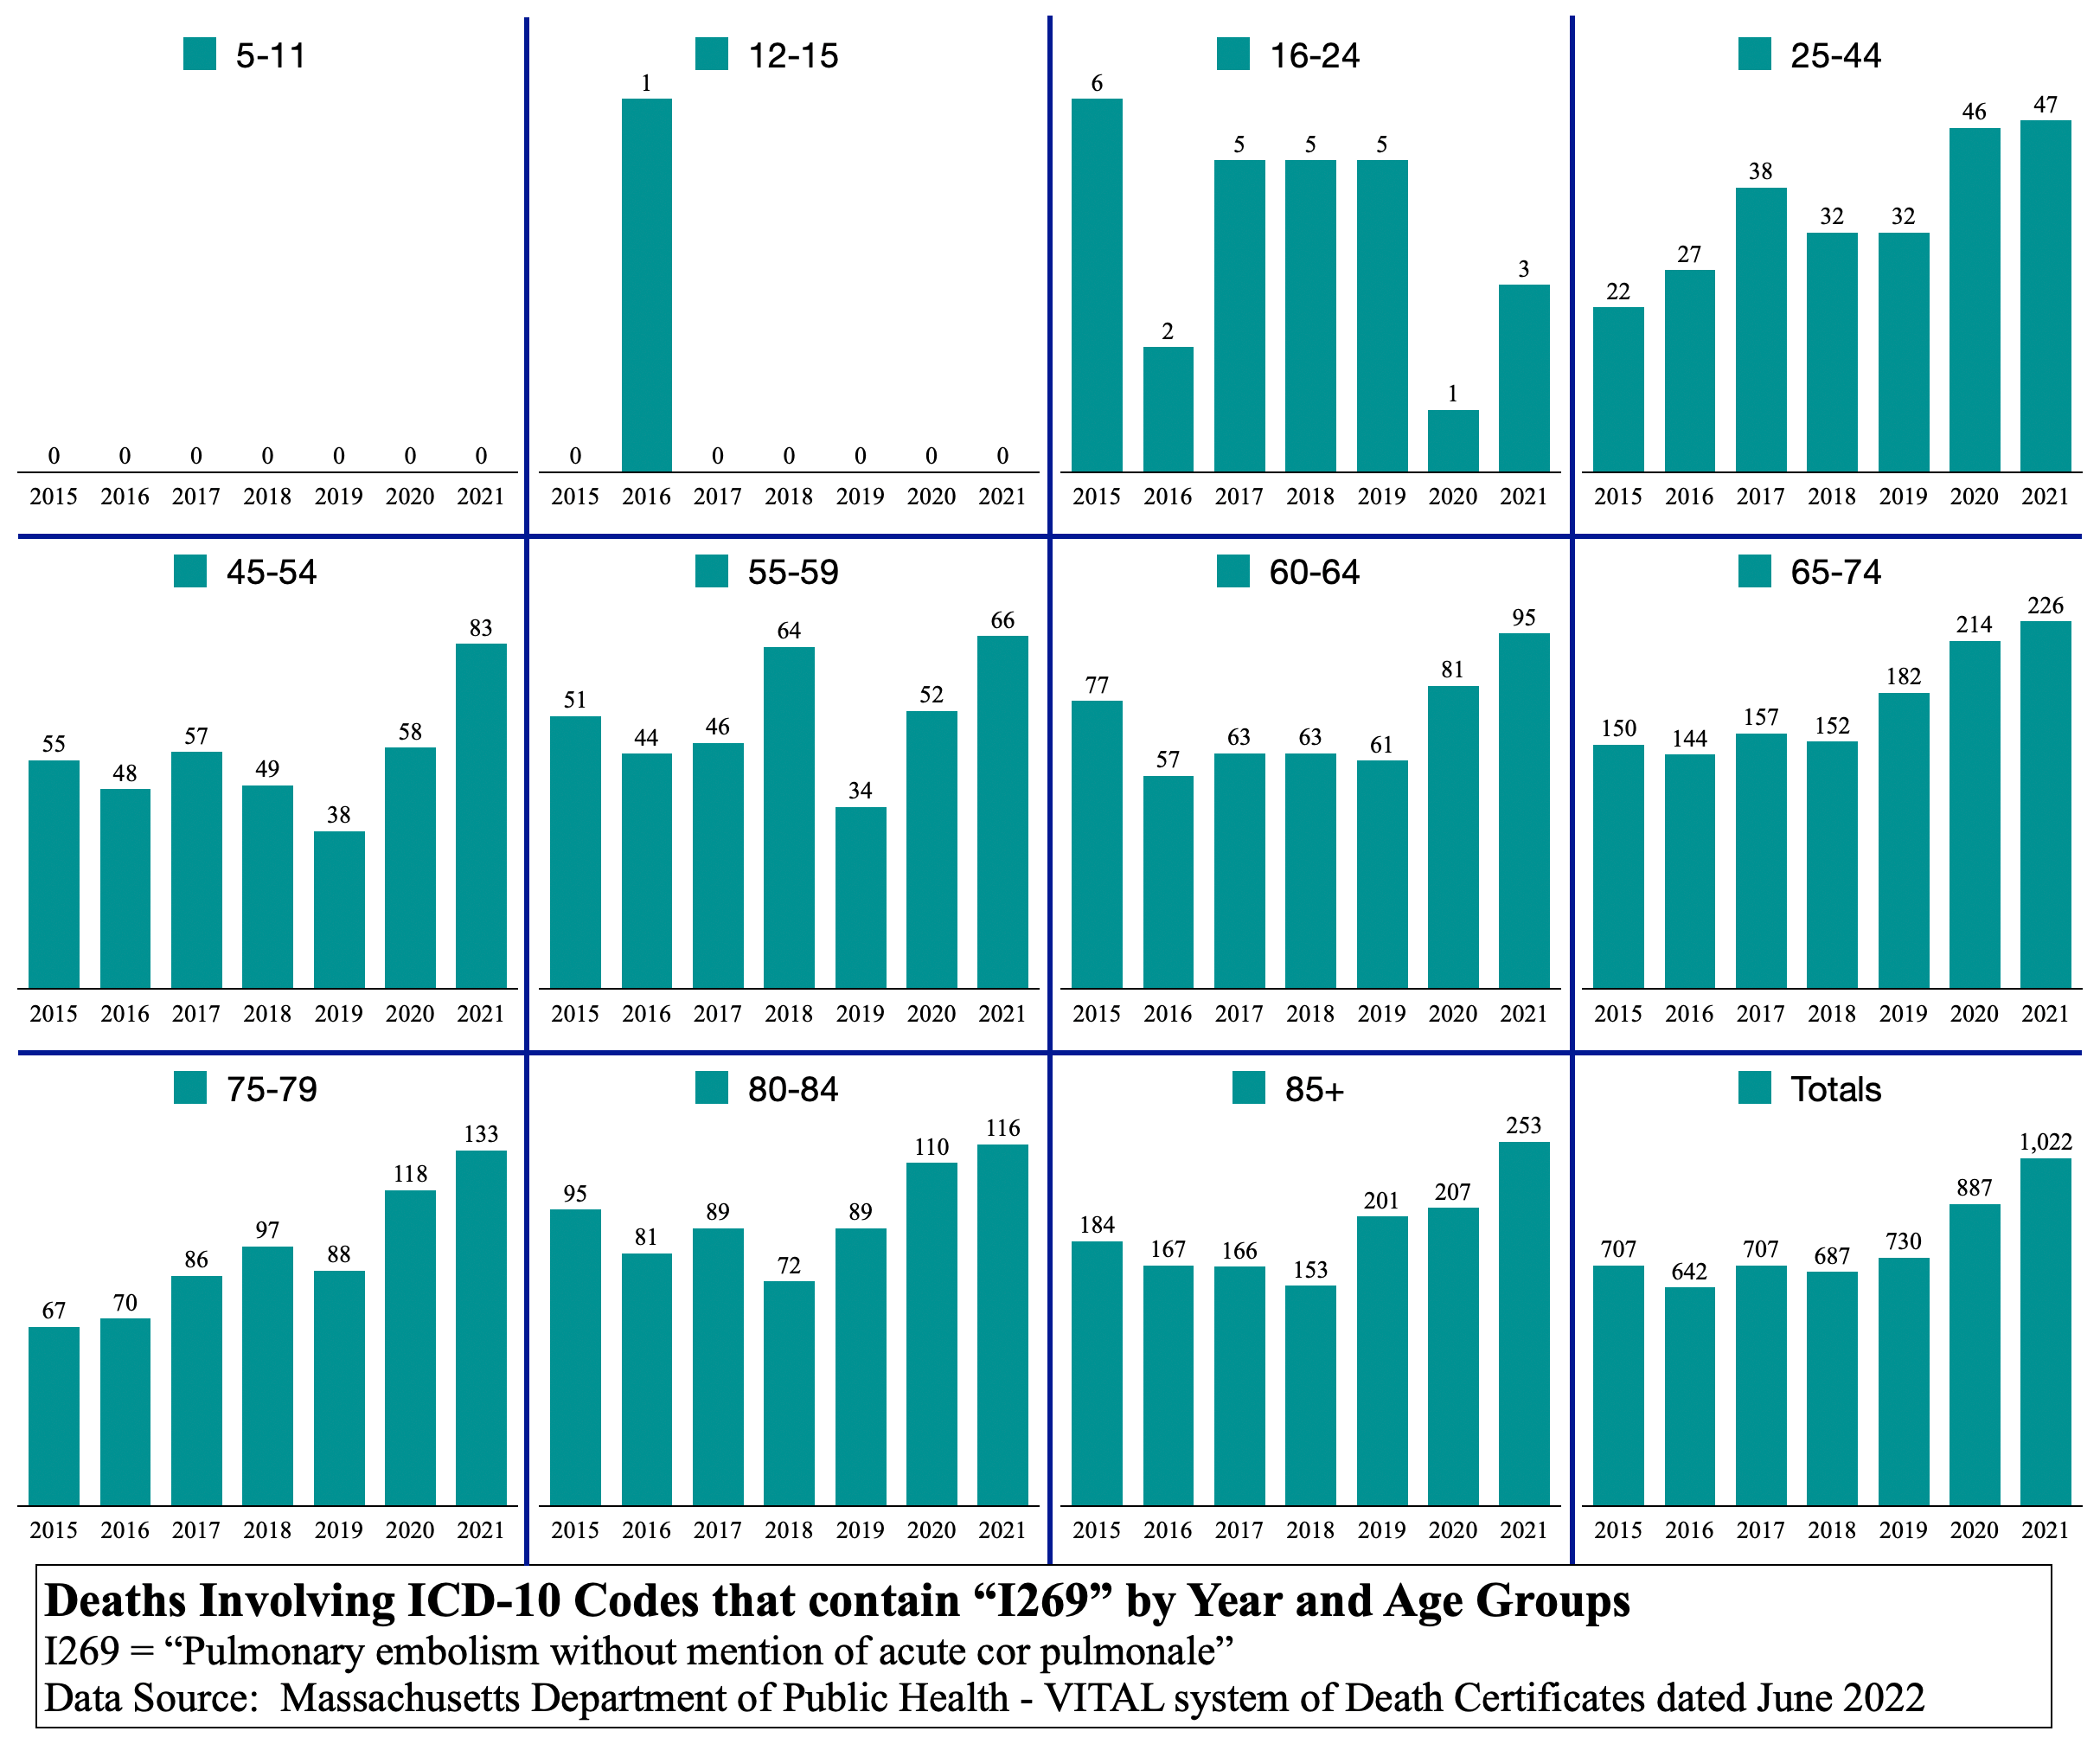
I269 Pulmonary embolism without mention of acute cor pulmonale
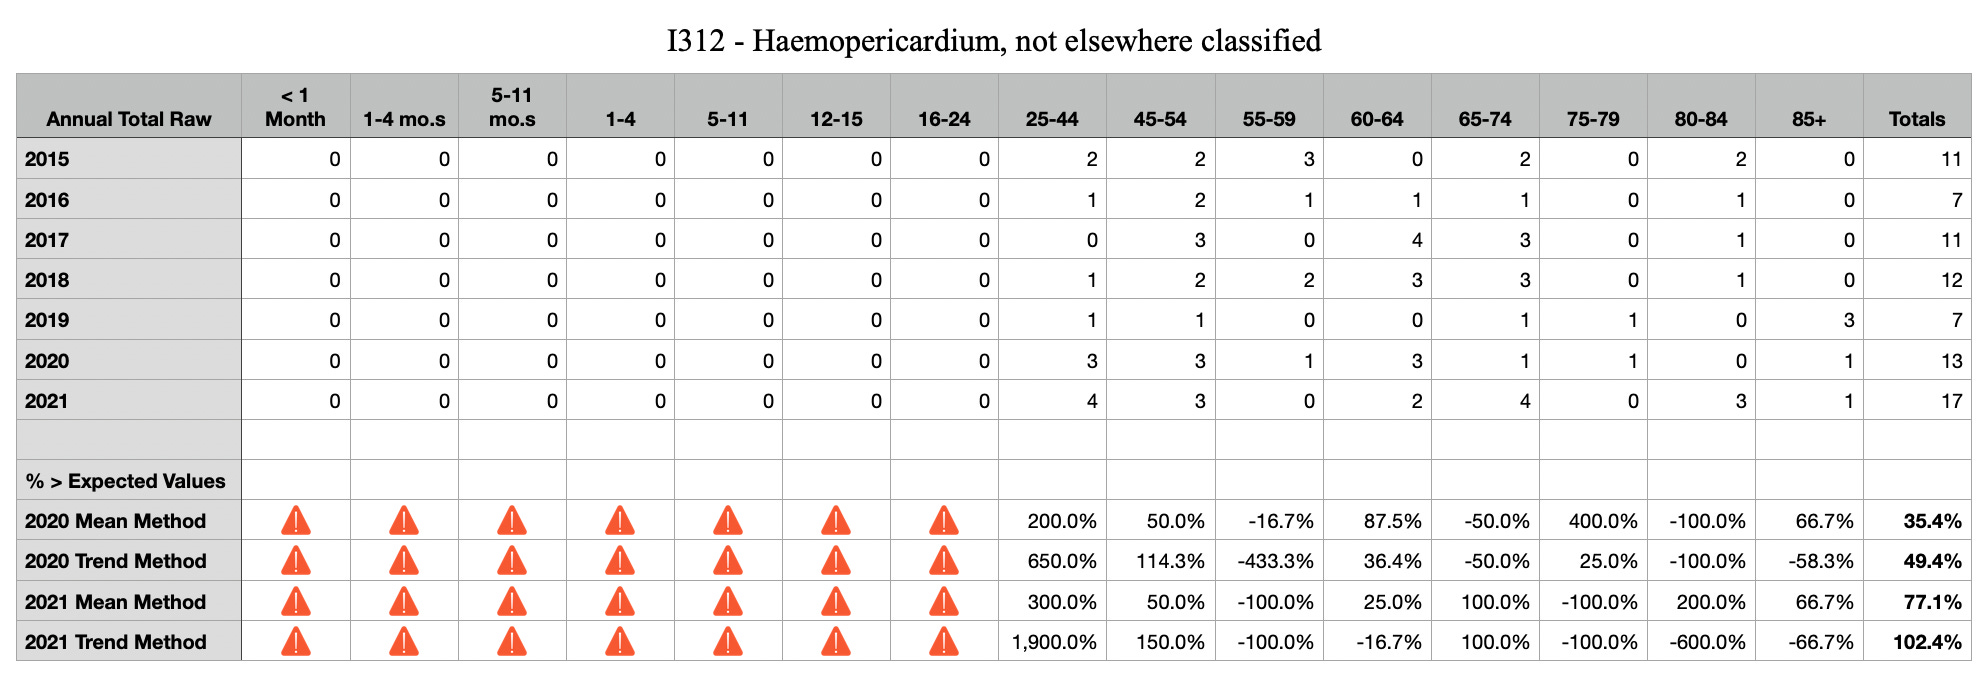
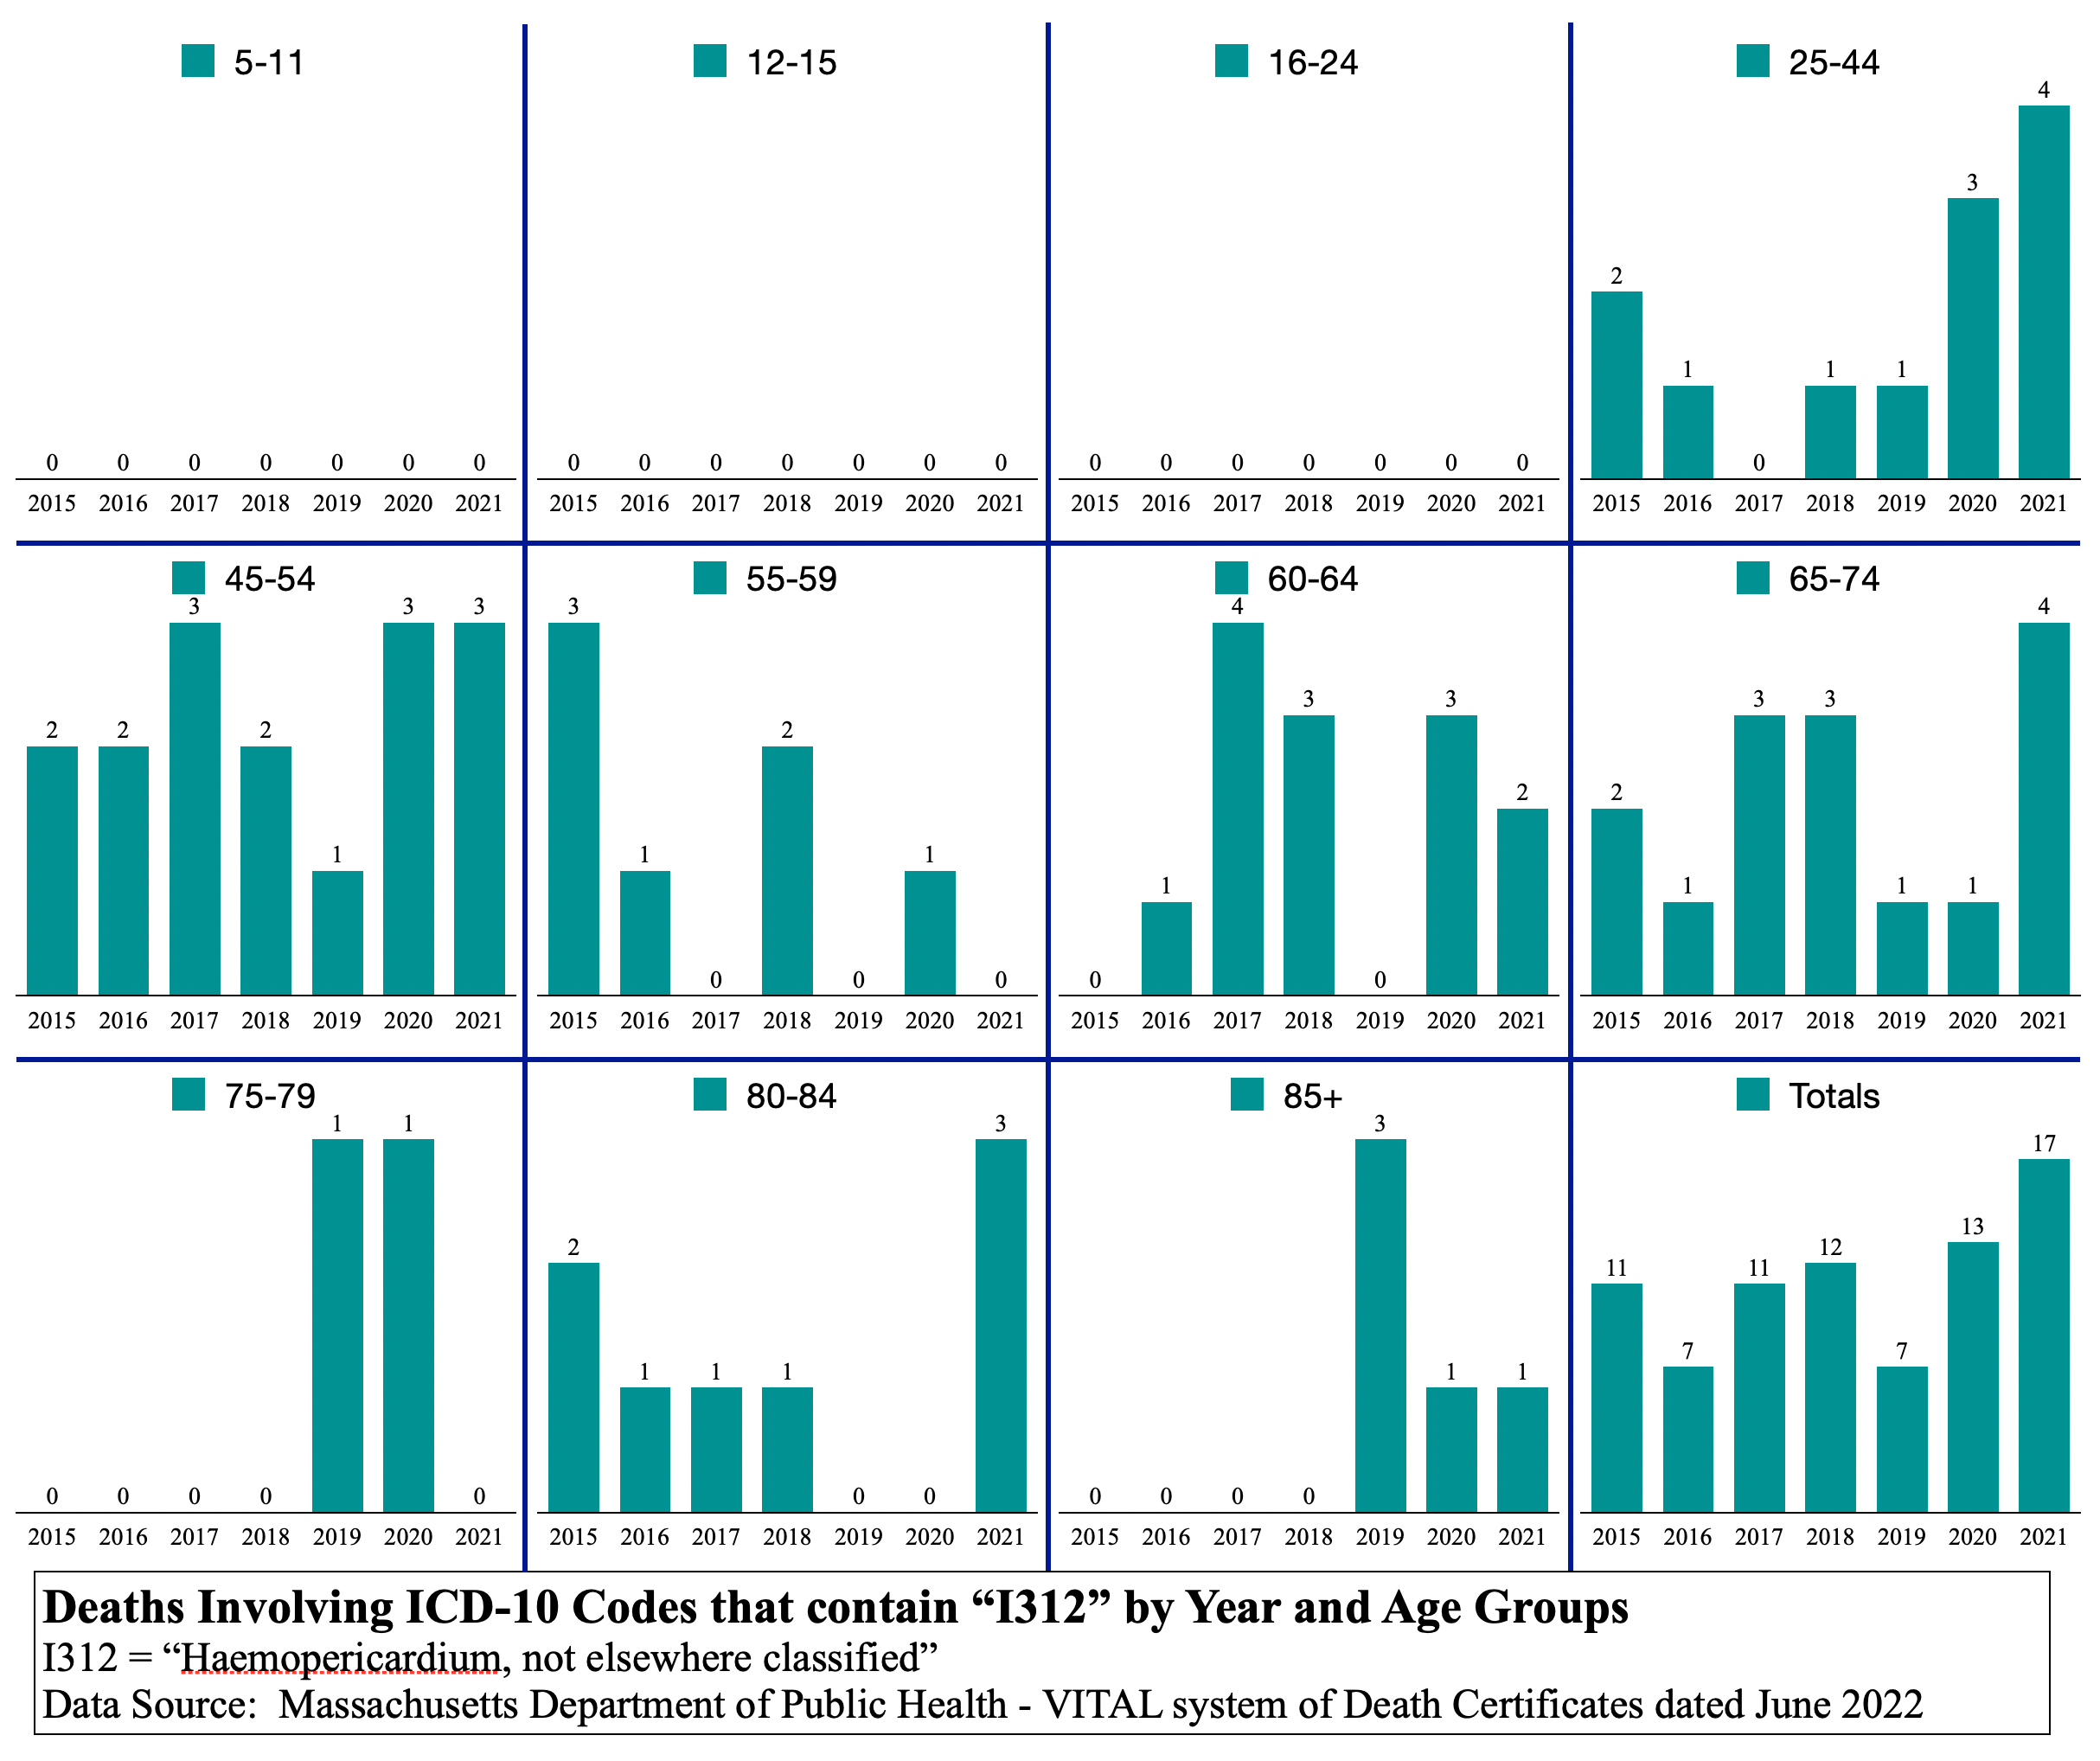
I312 Haemopericardium
I313 Pericardial effusion

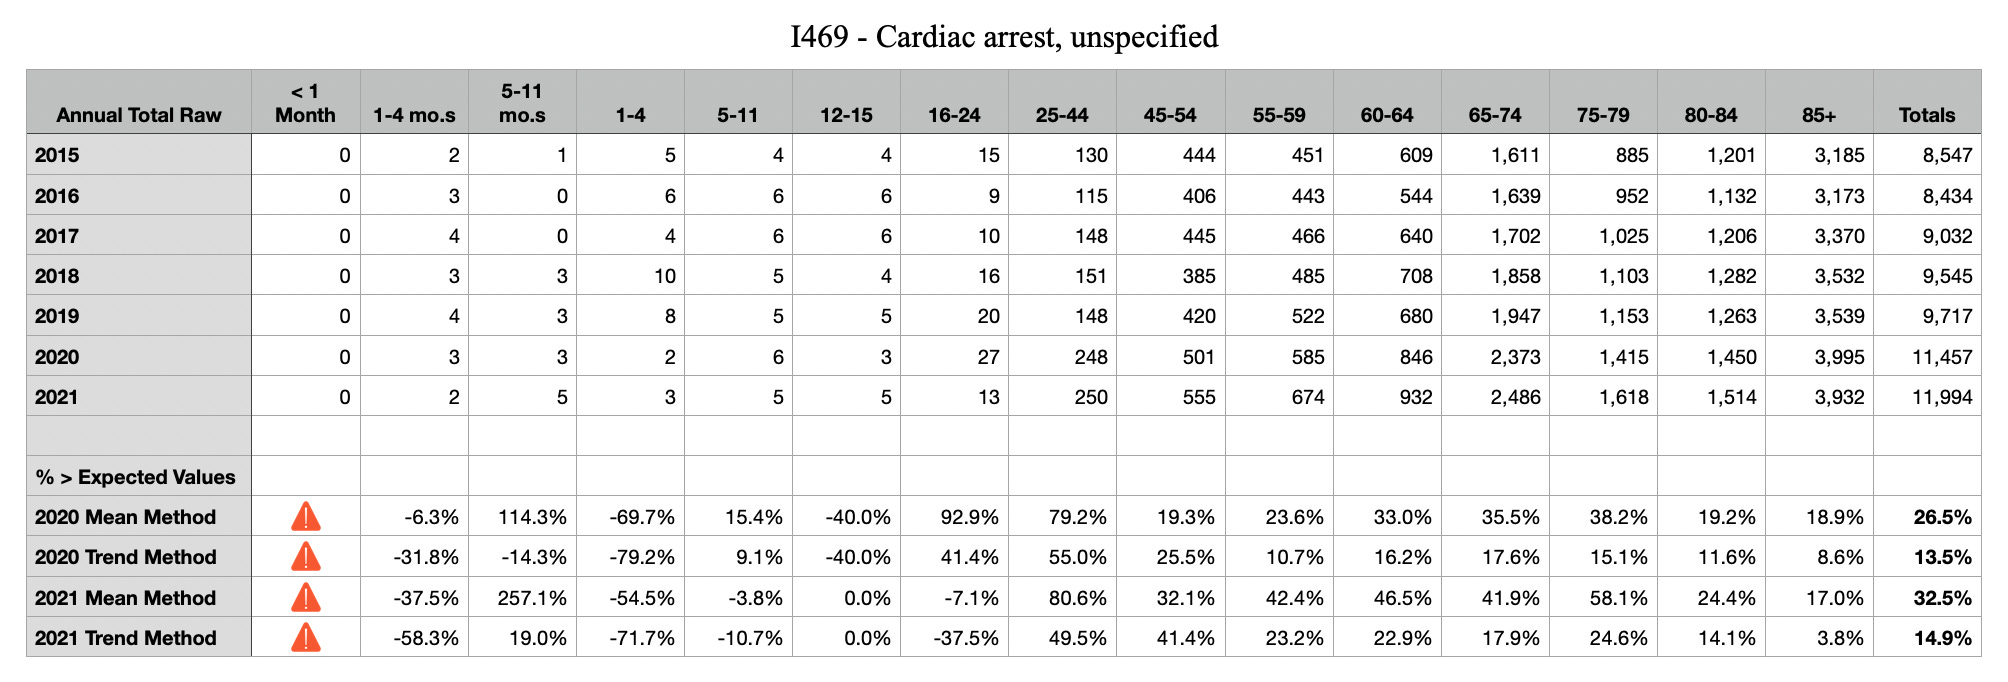
I469 Cardiac arrest
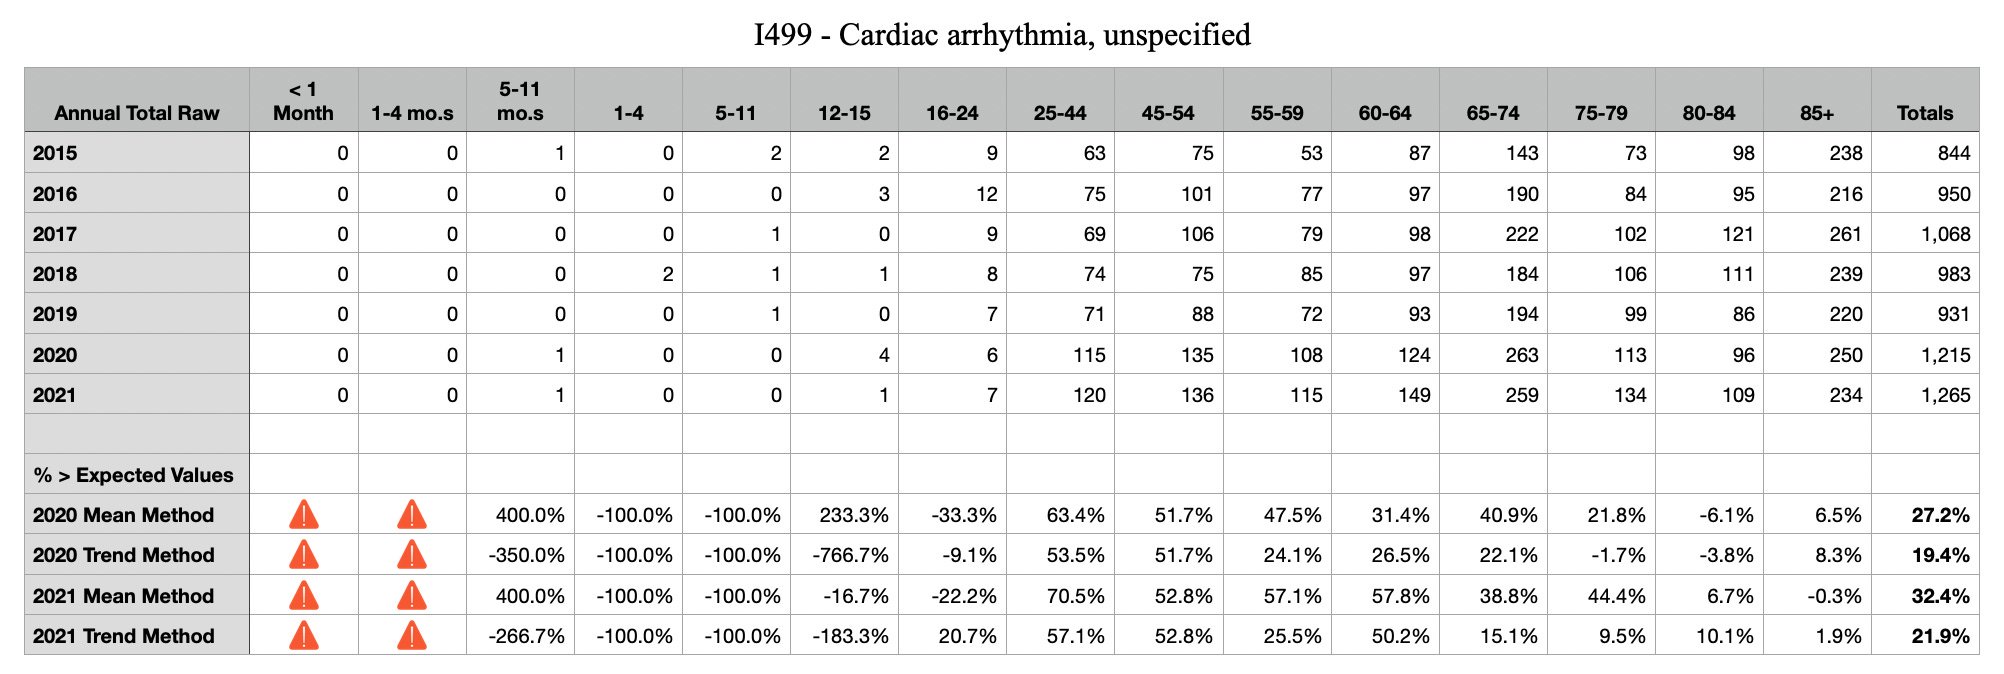
I499 Arrhythmia

I514 Myocarditis, unspecified
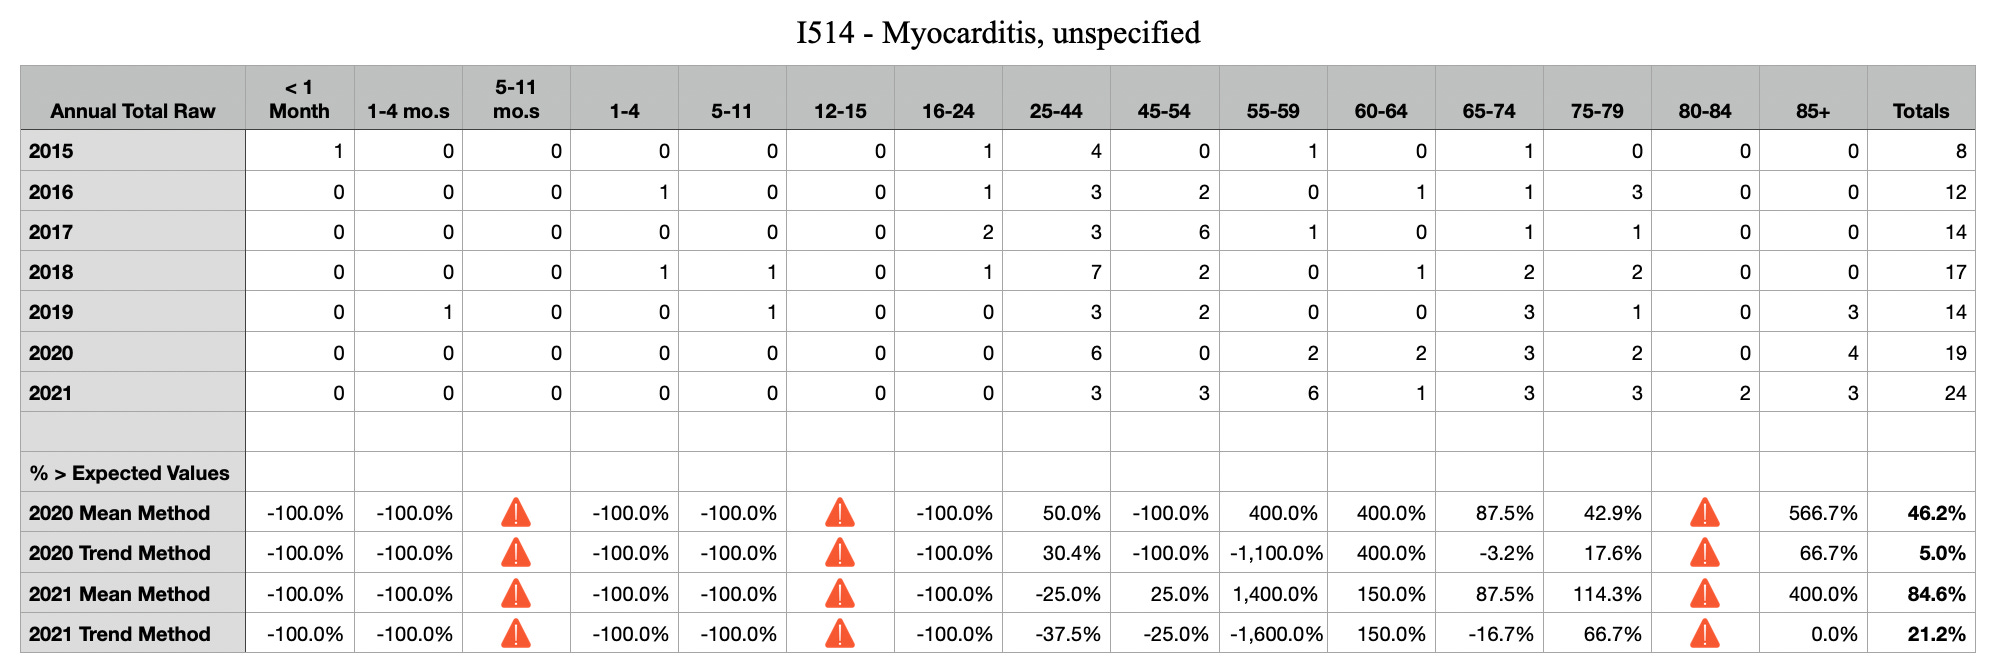
Note that there are different kinds of myocarditis that are not included in the graph above. Specifically, eosinophilic myocarditis would be included under a different ICD-10 code and in fact, a 20-year-old civil engineering student from NH died at Mass General Hospital on 12/22/2021 of eosinophilic myocarditis. Gee, I wonder what caused that. Poor kid had so much life ahead of her.
Secondly, myocarditis is a pet peeve of mine in that it gets all the attention for such a small number of occurrences. The strategy of the opposition is to fragment issues into small buckets of concern, whereas, in aggregate, all circulatory system related issues are a massive signal of public health emergency. Anyone mentioning myocarditis related to C19 vaccine injury should ALWAYS include “one of the many known C19 vaccine circulatory system issues.”
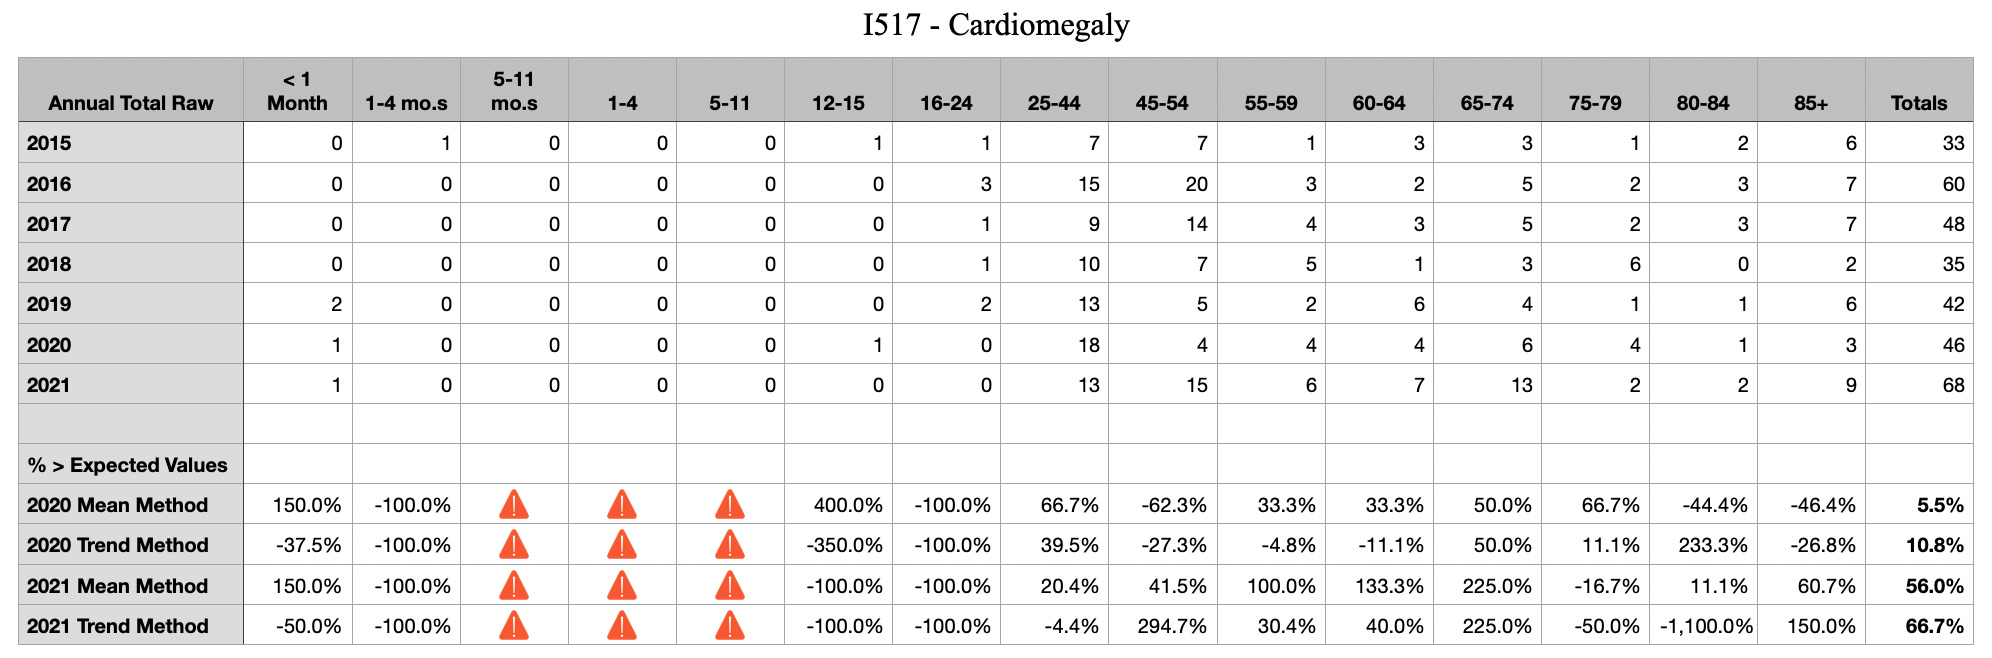
I517 Cardiomegaly
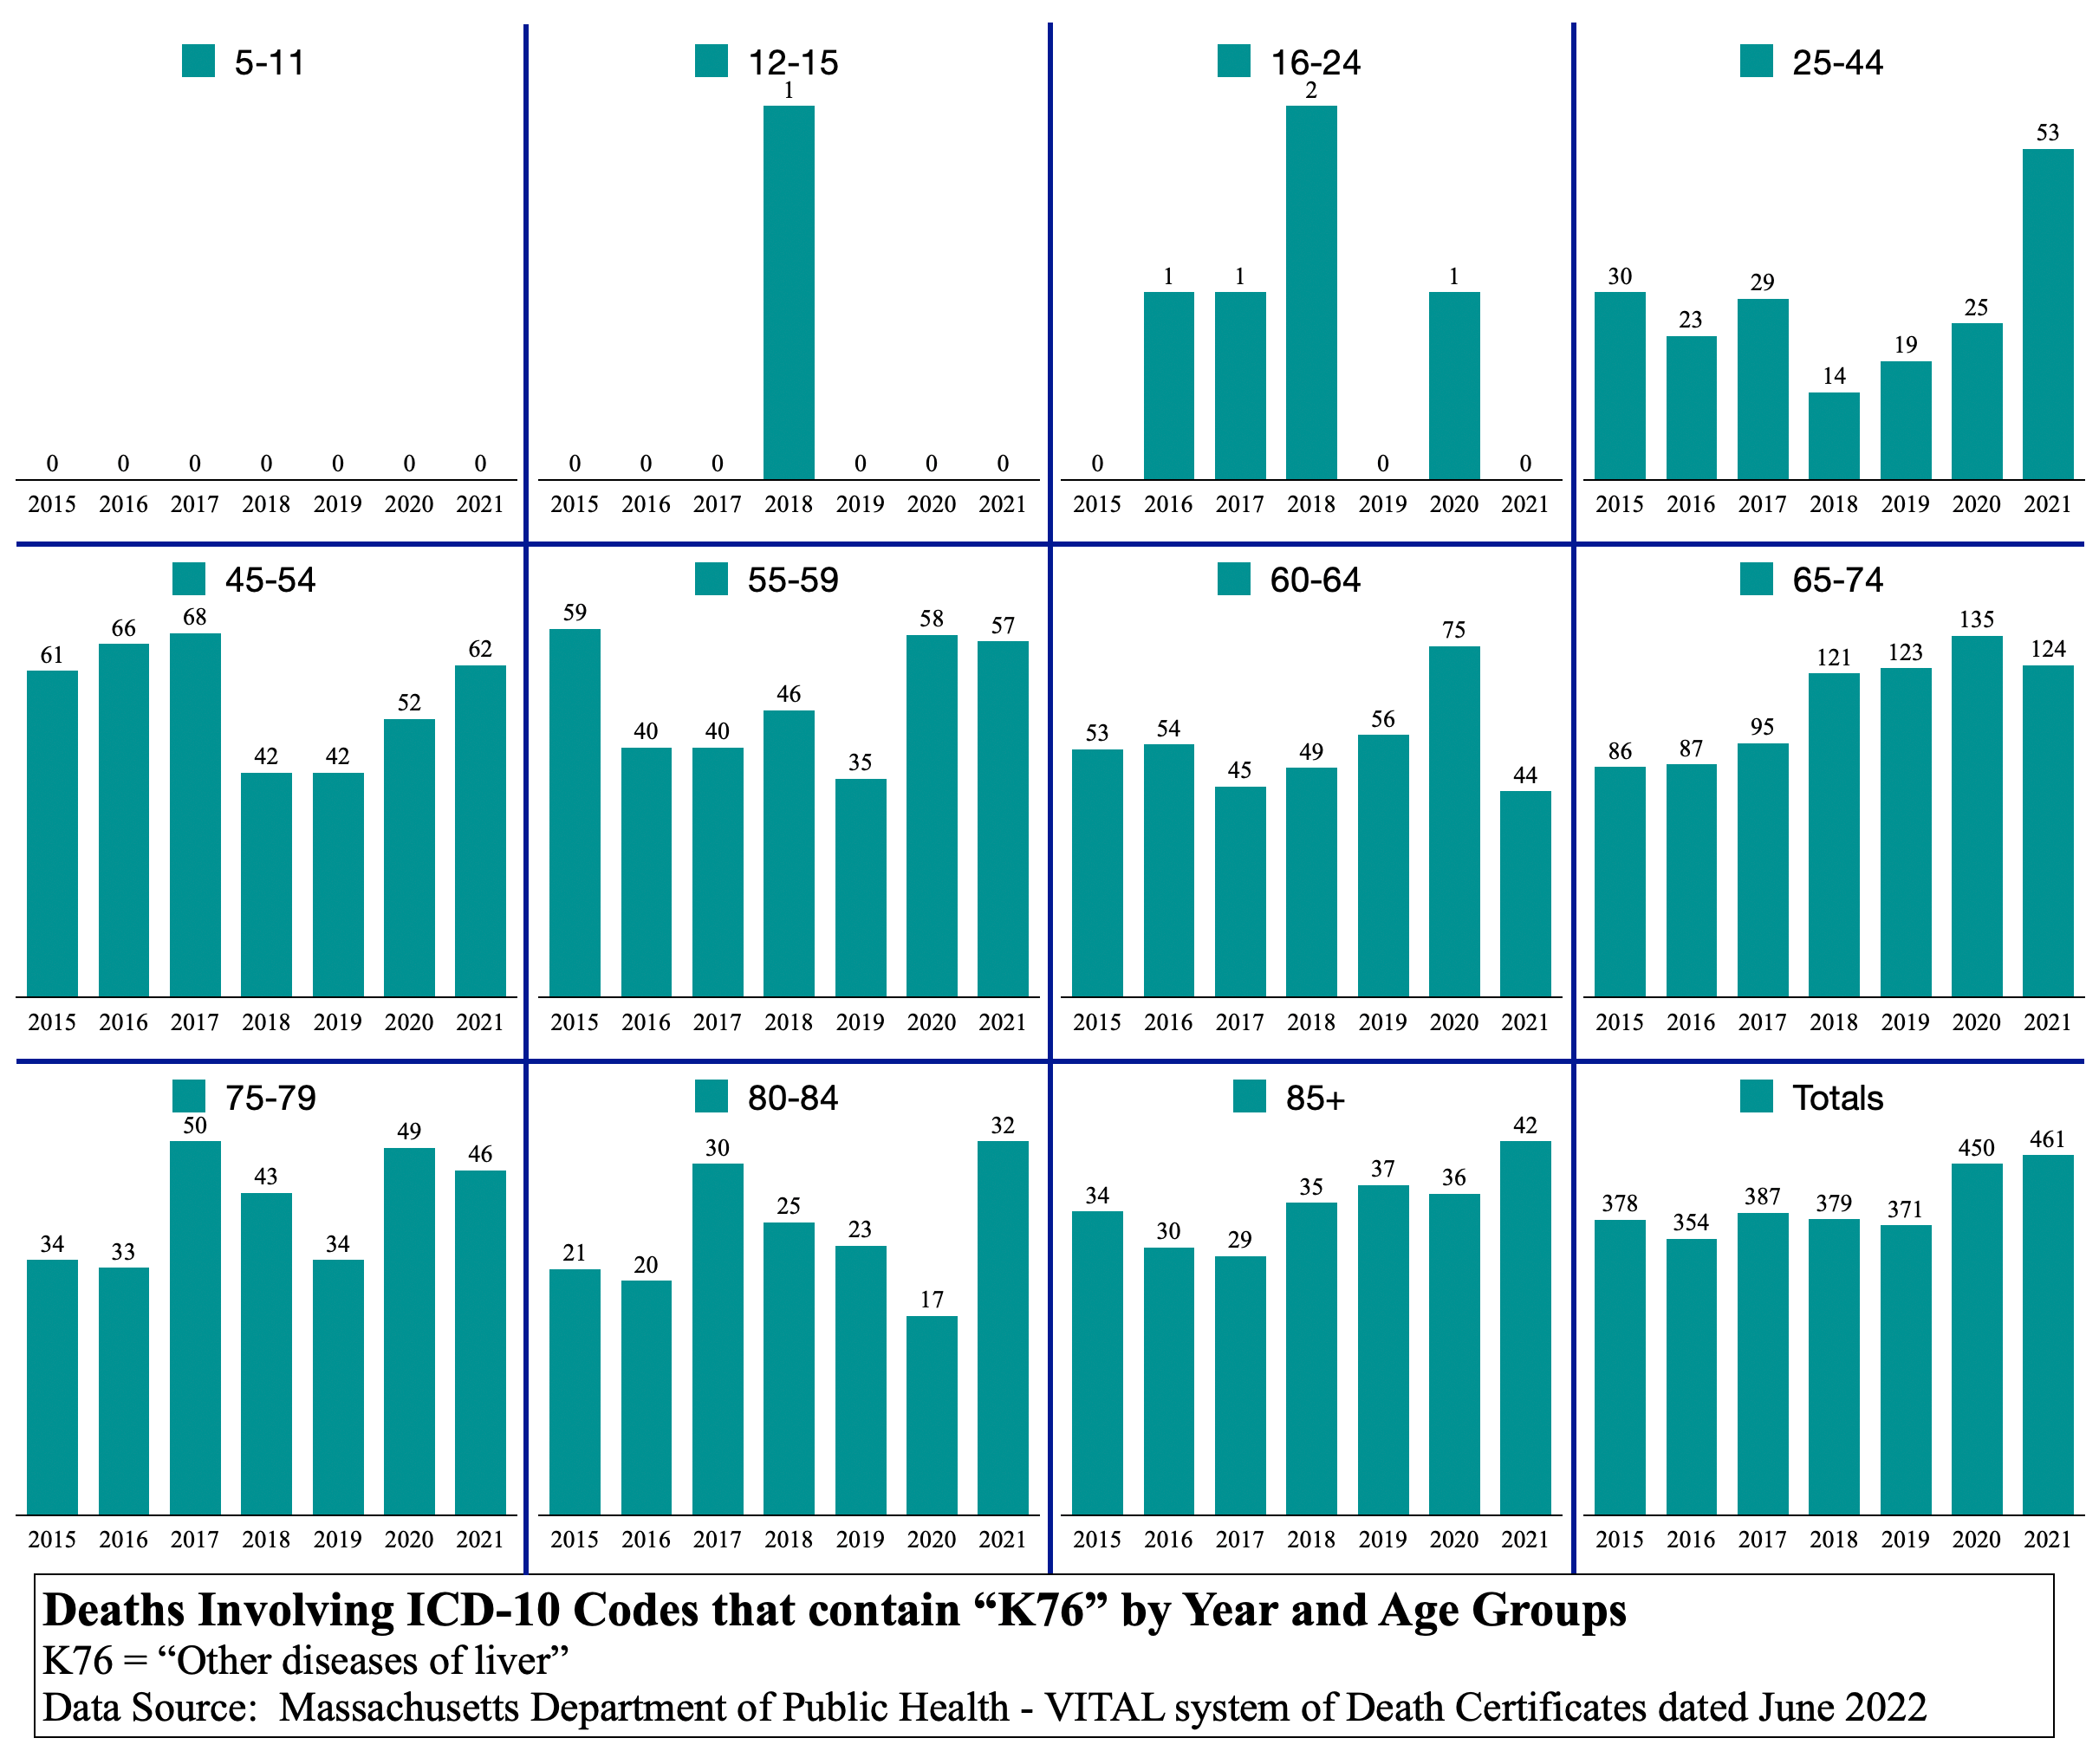
K76 Other diseases of the liver

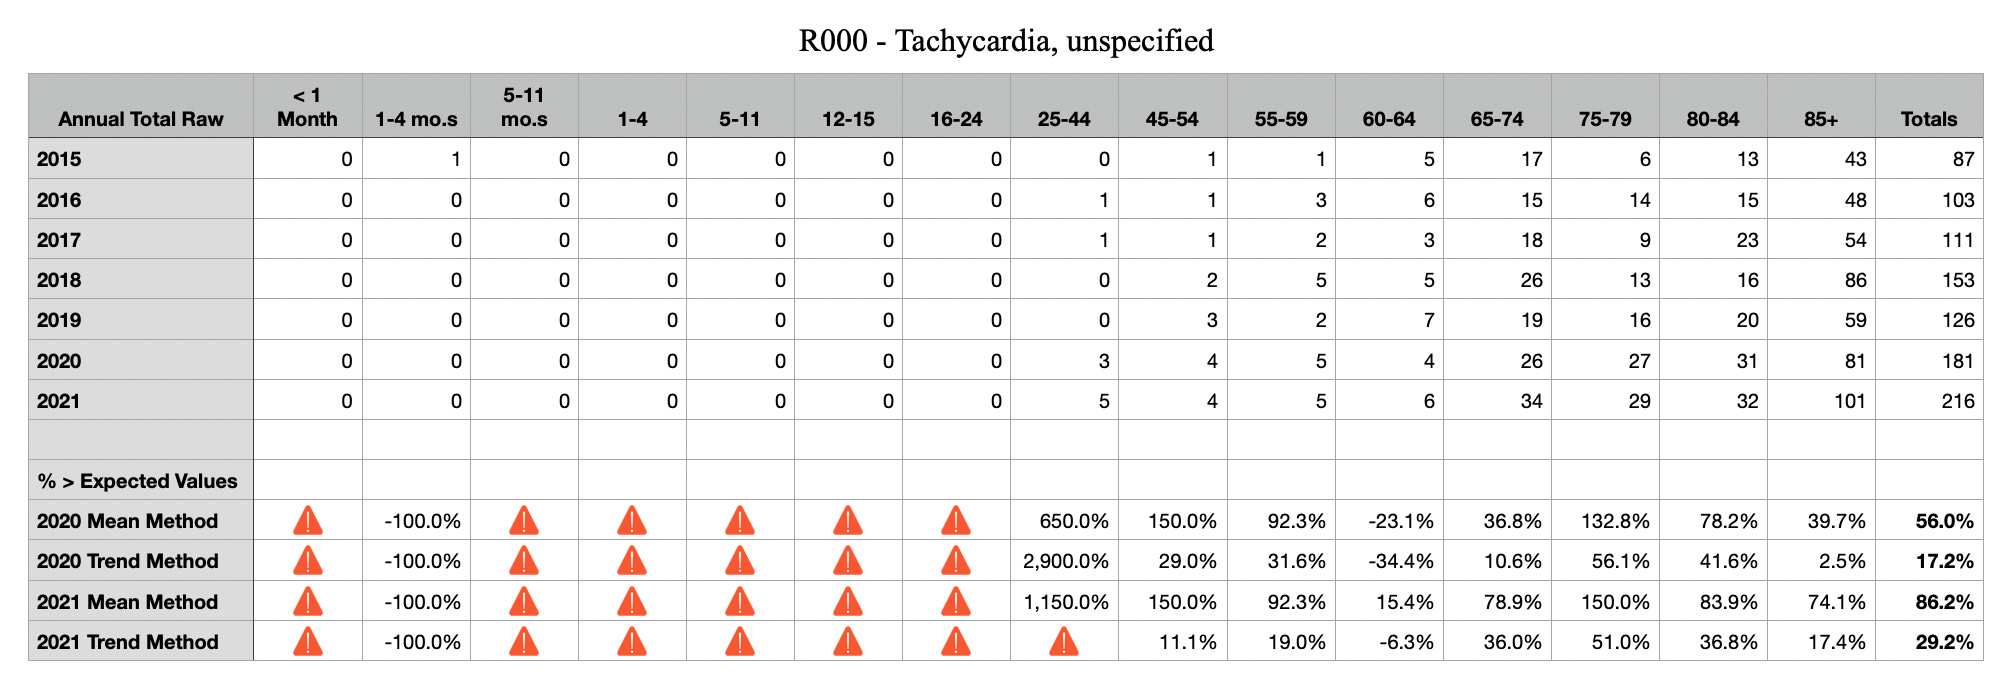
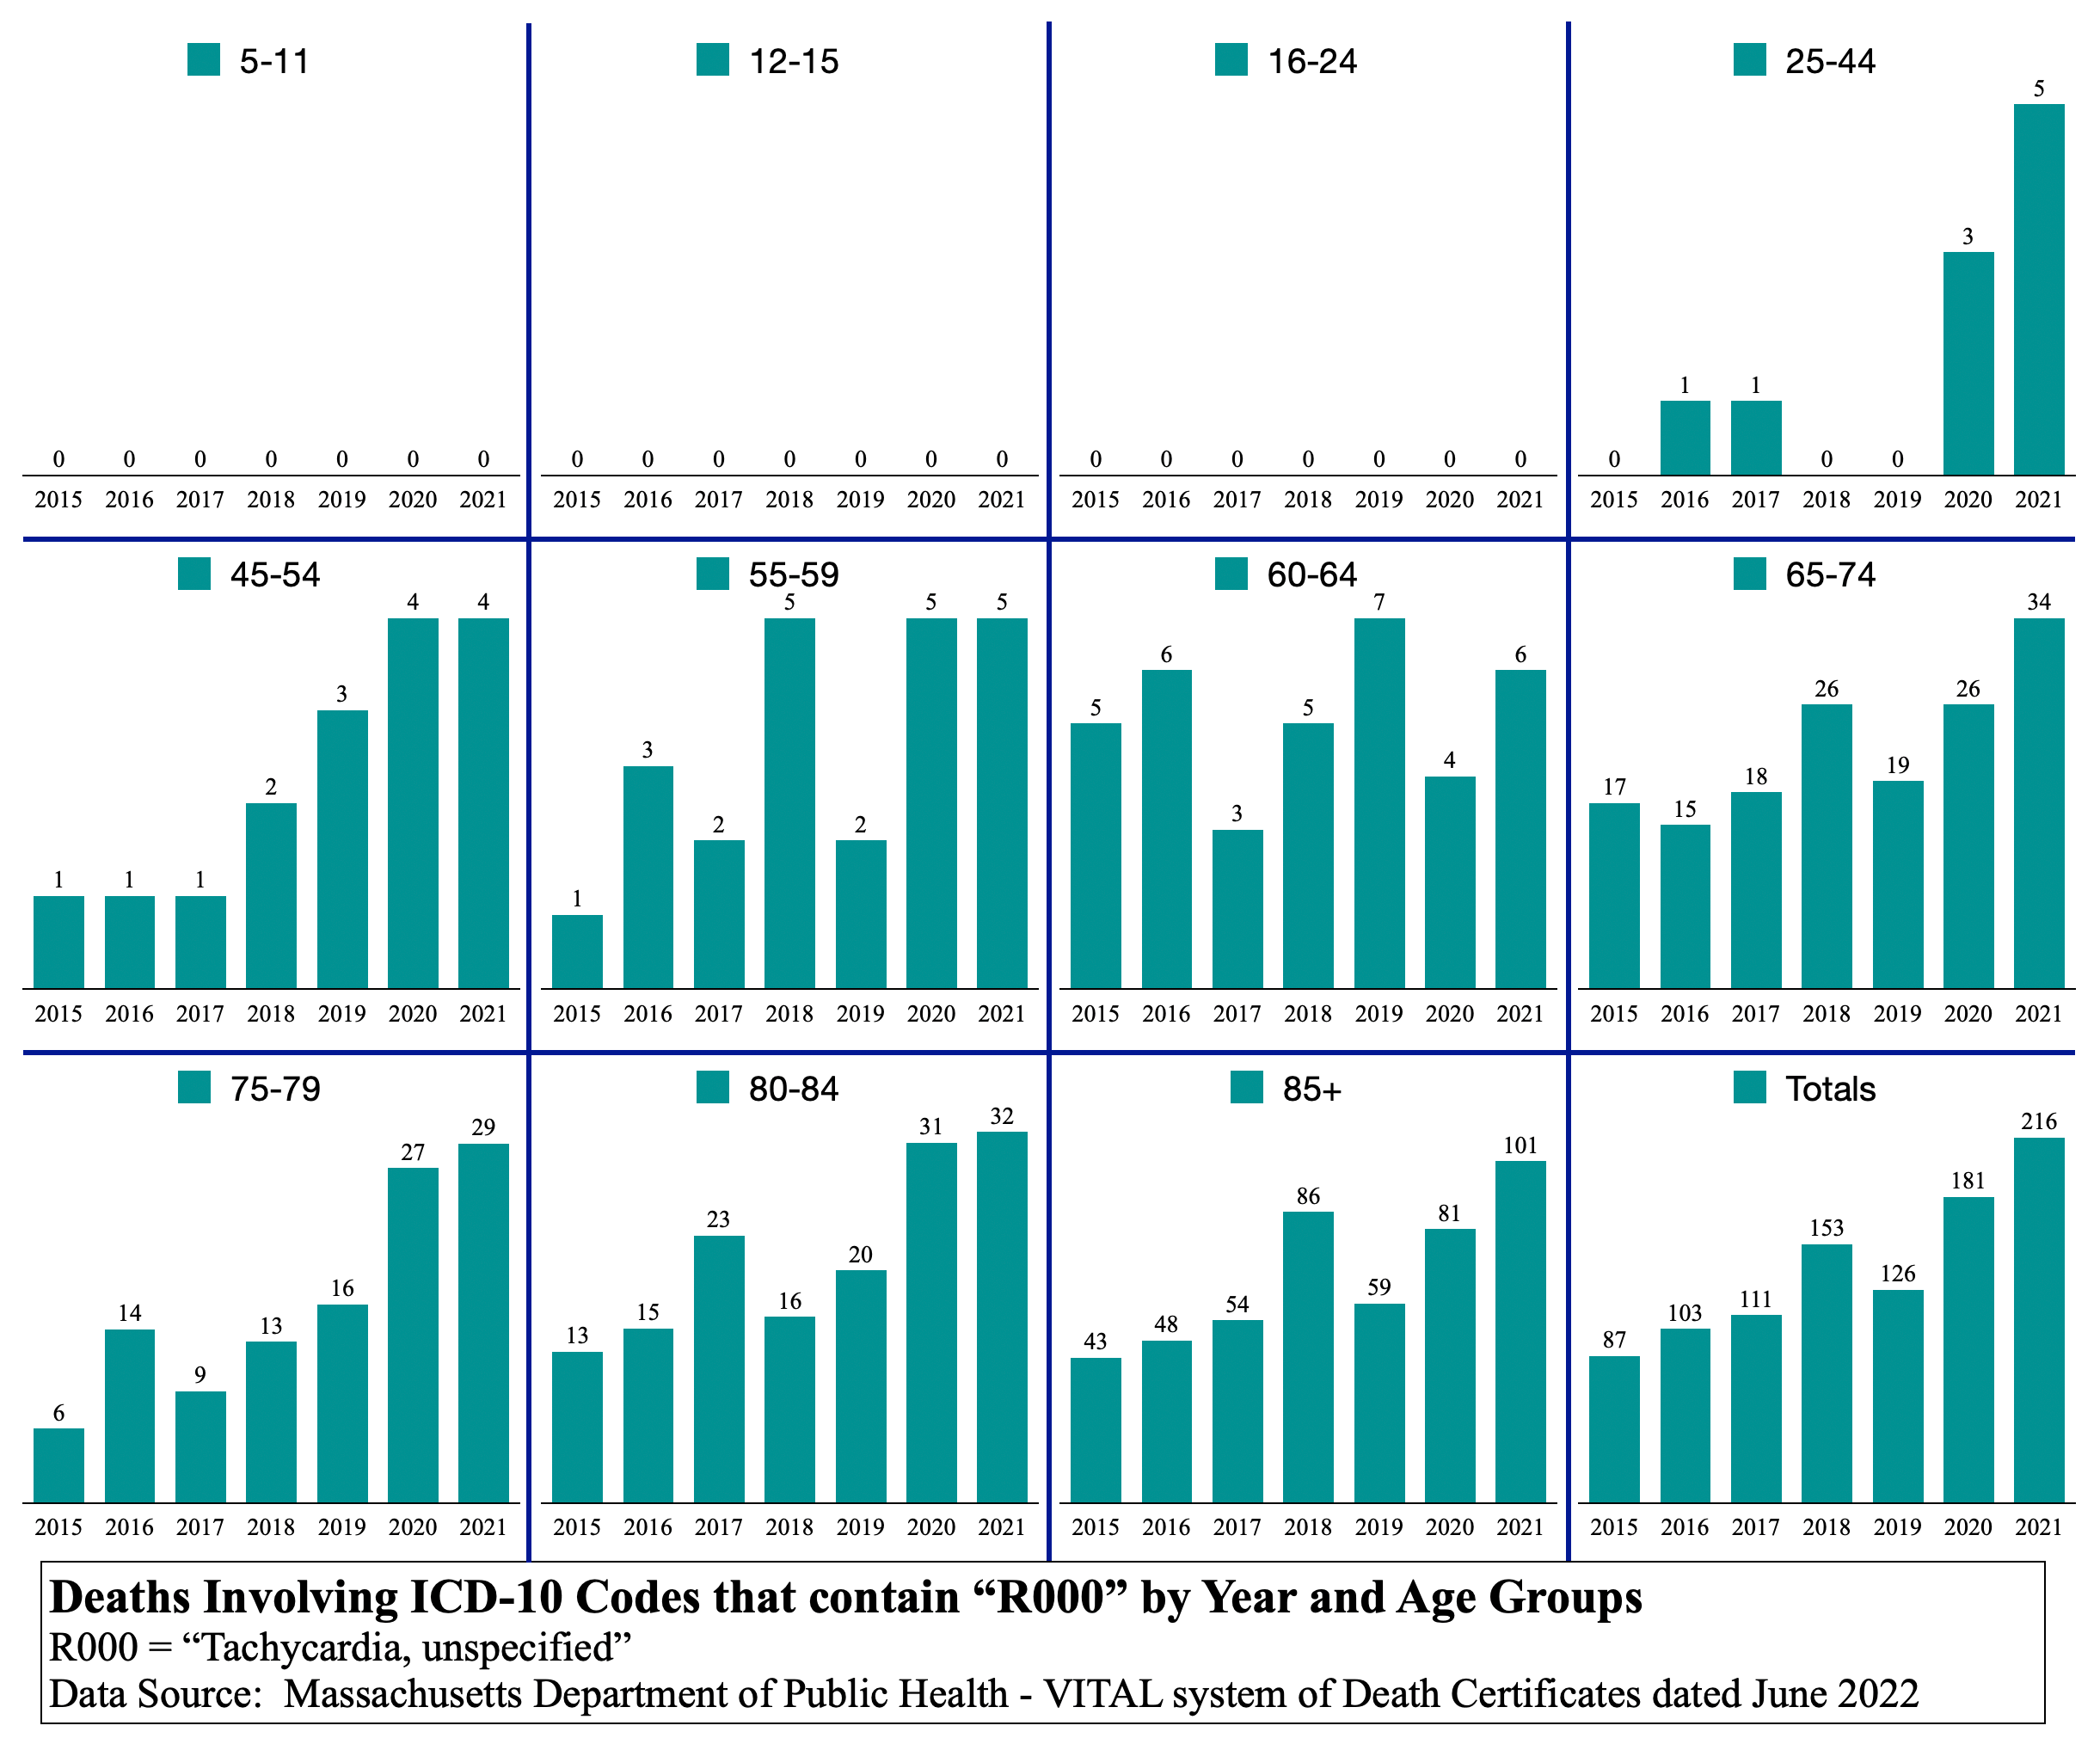
R000 Tachycardia
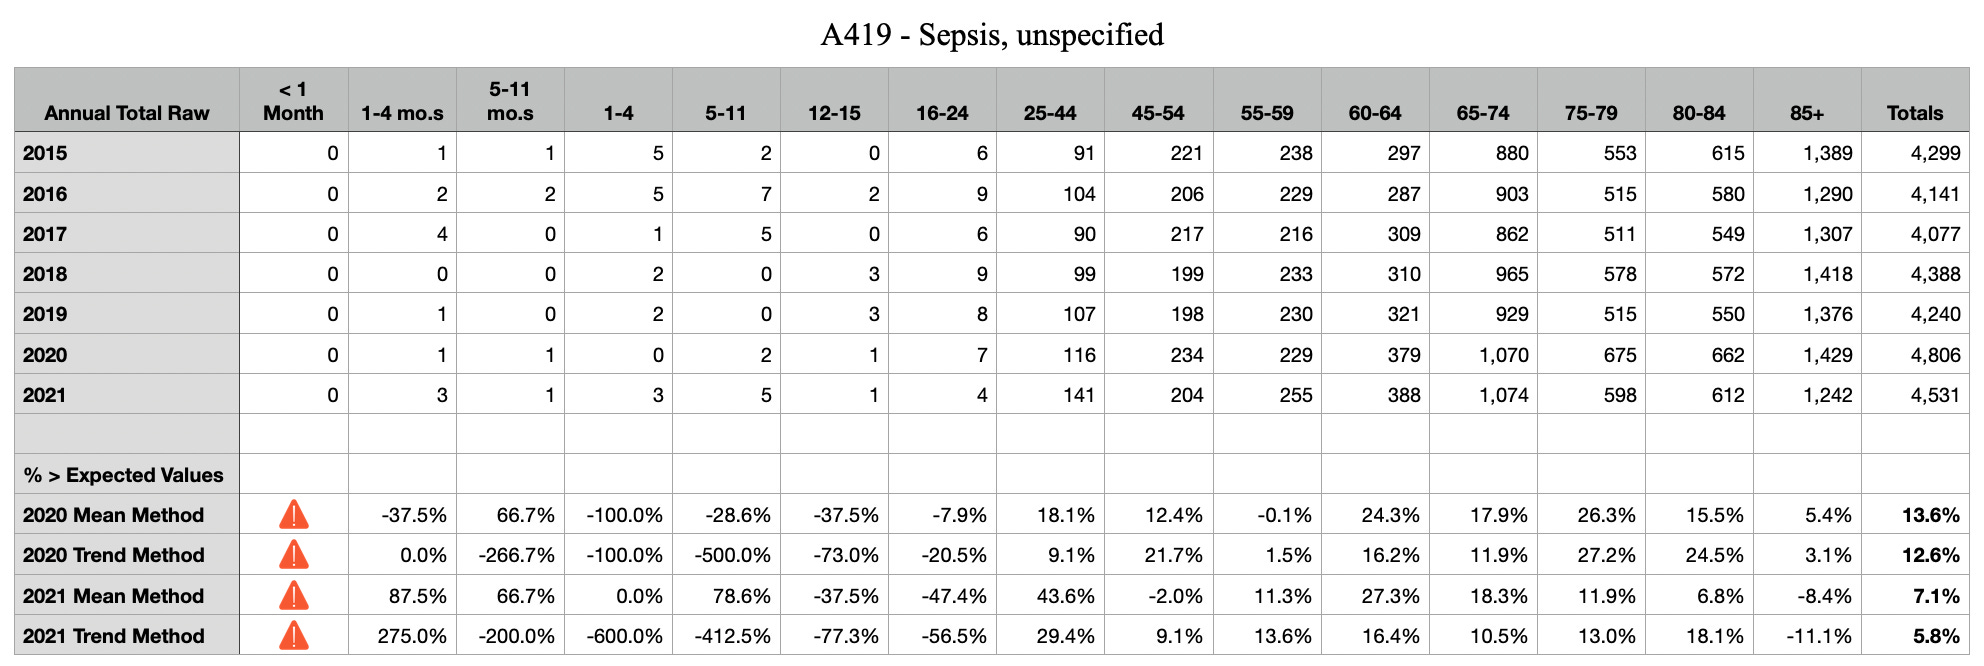
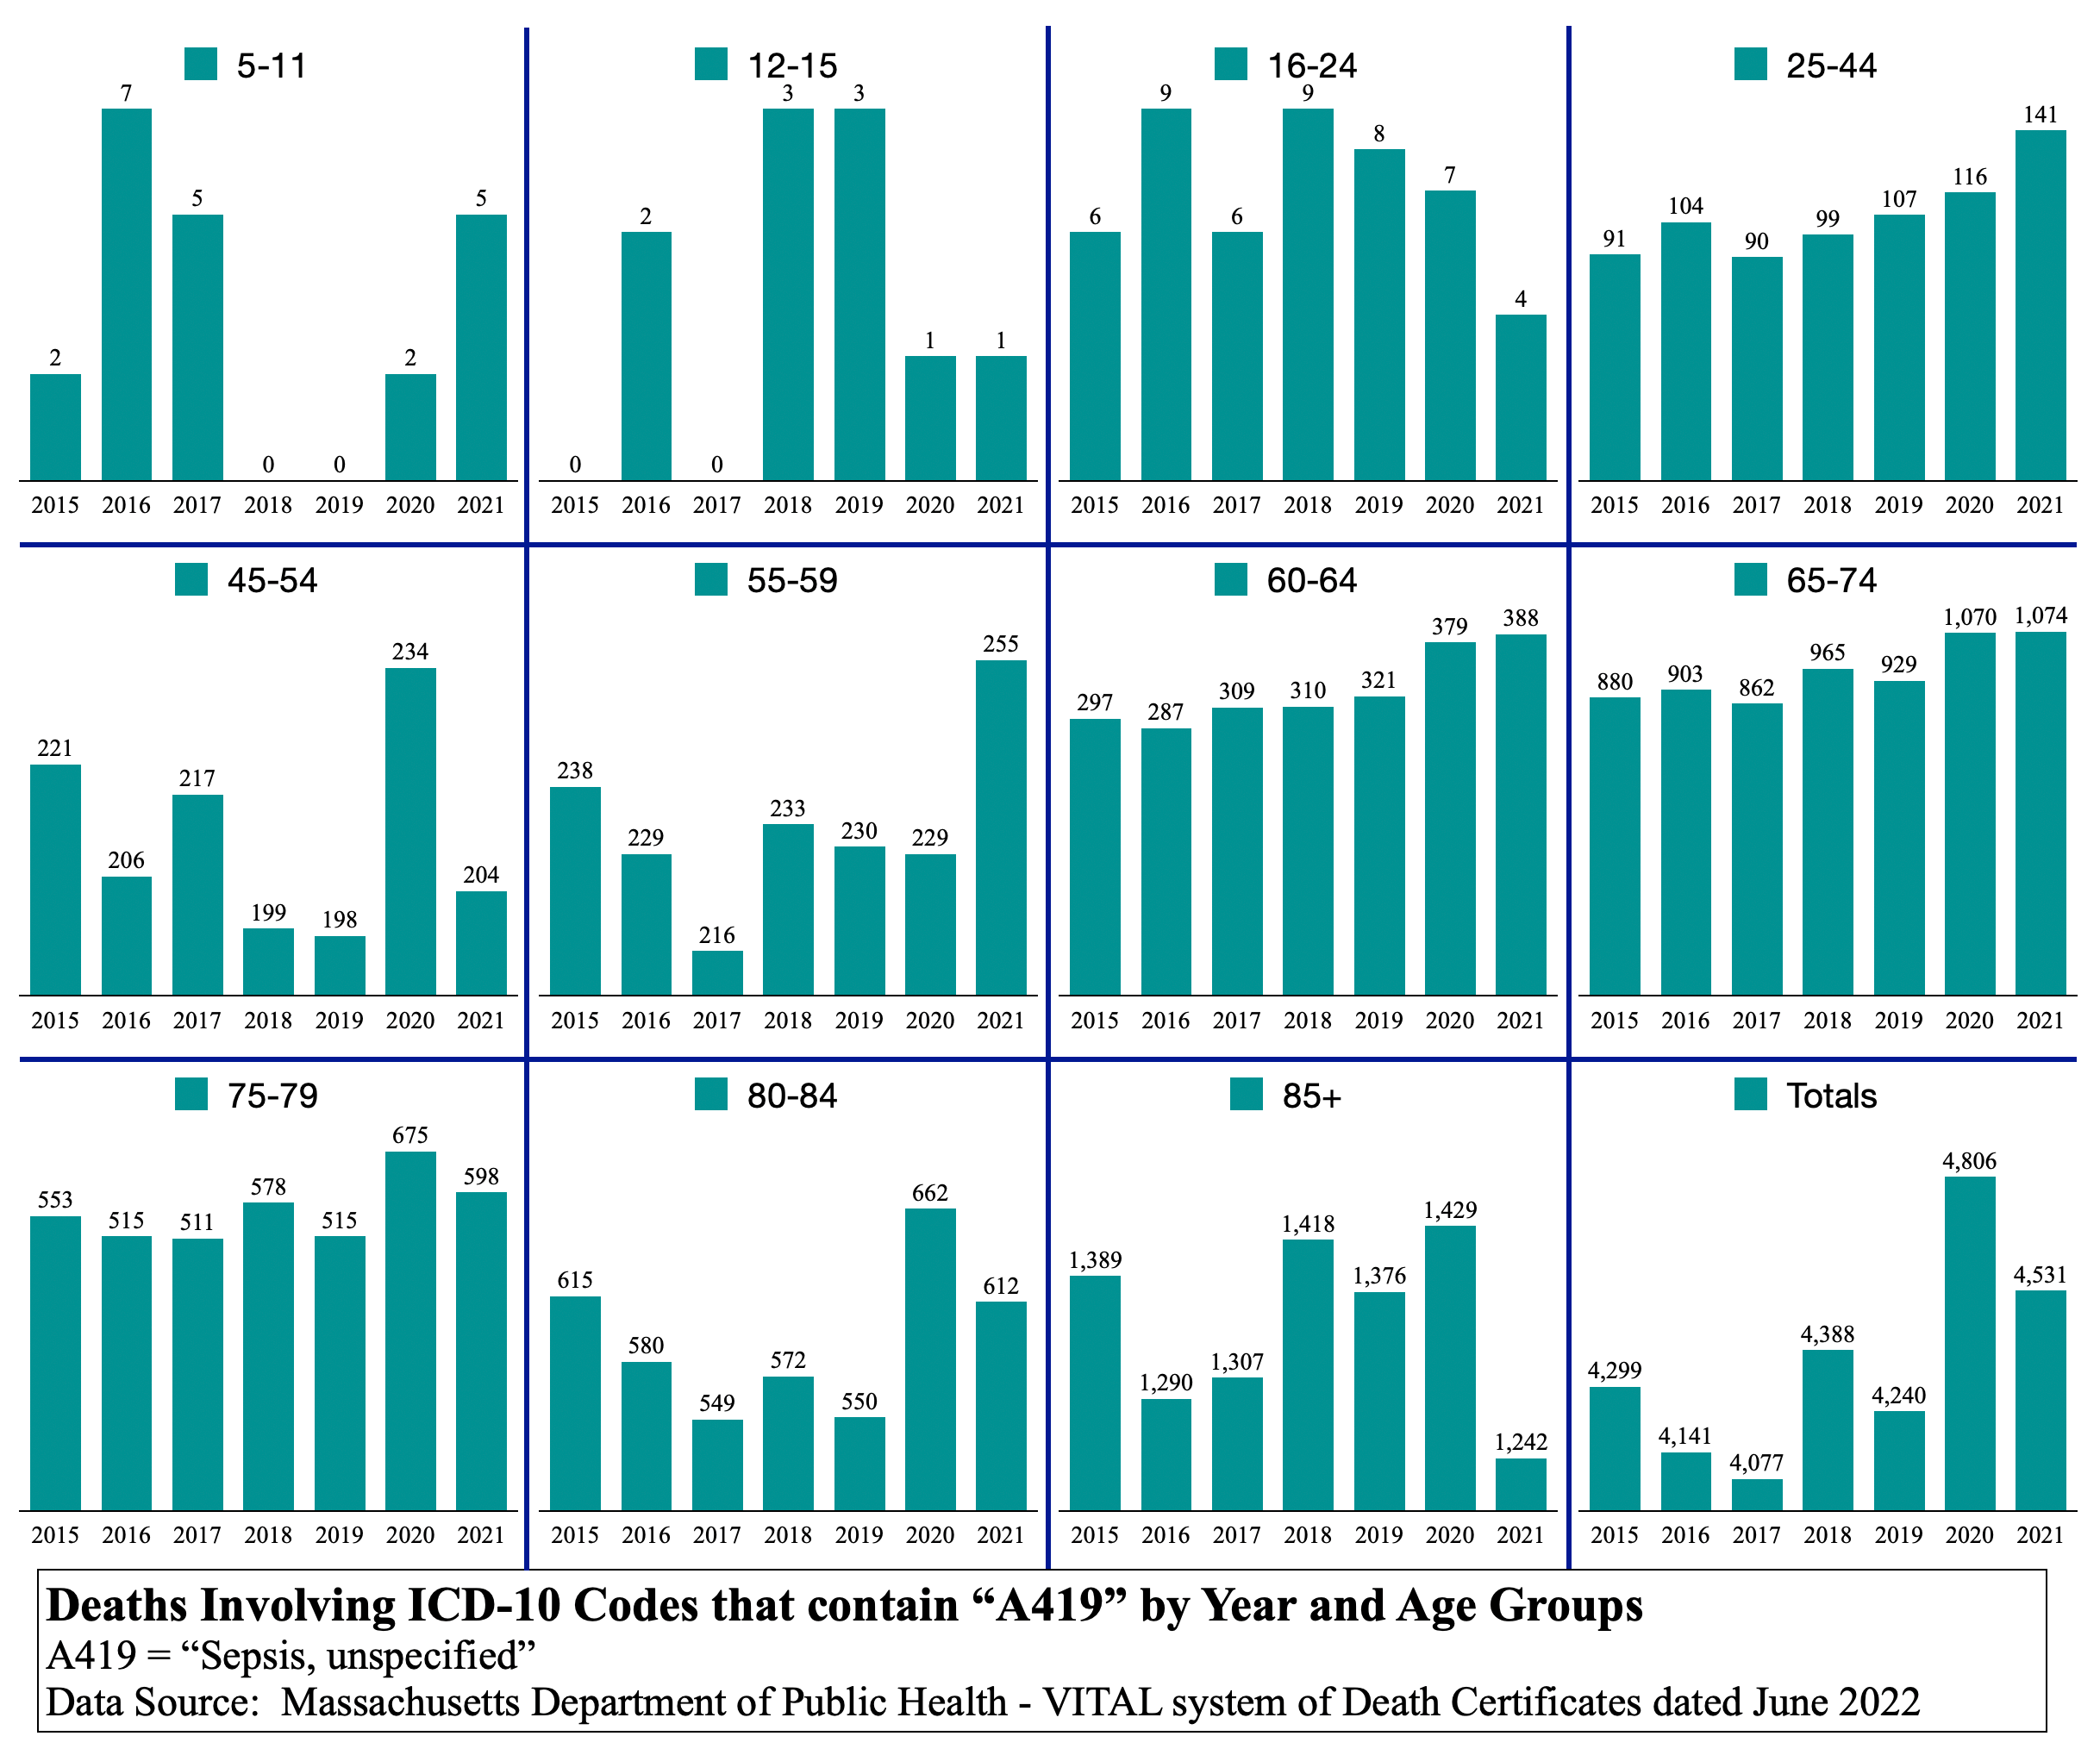
A419 Sepsis
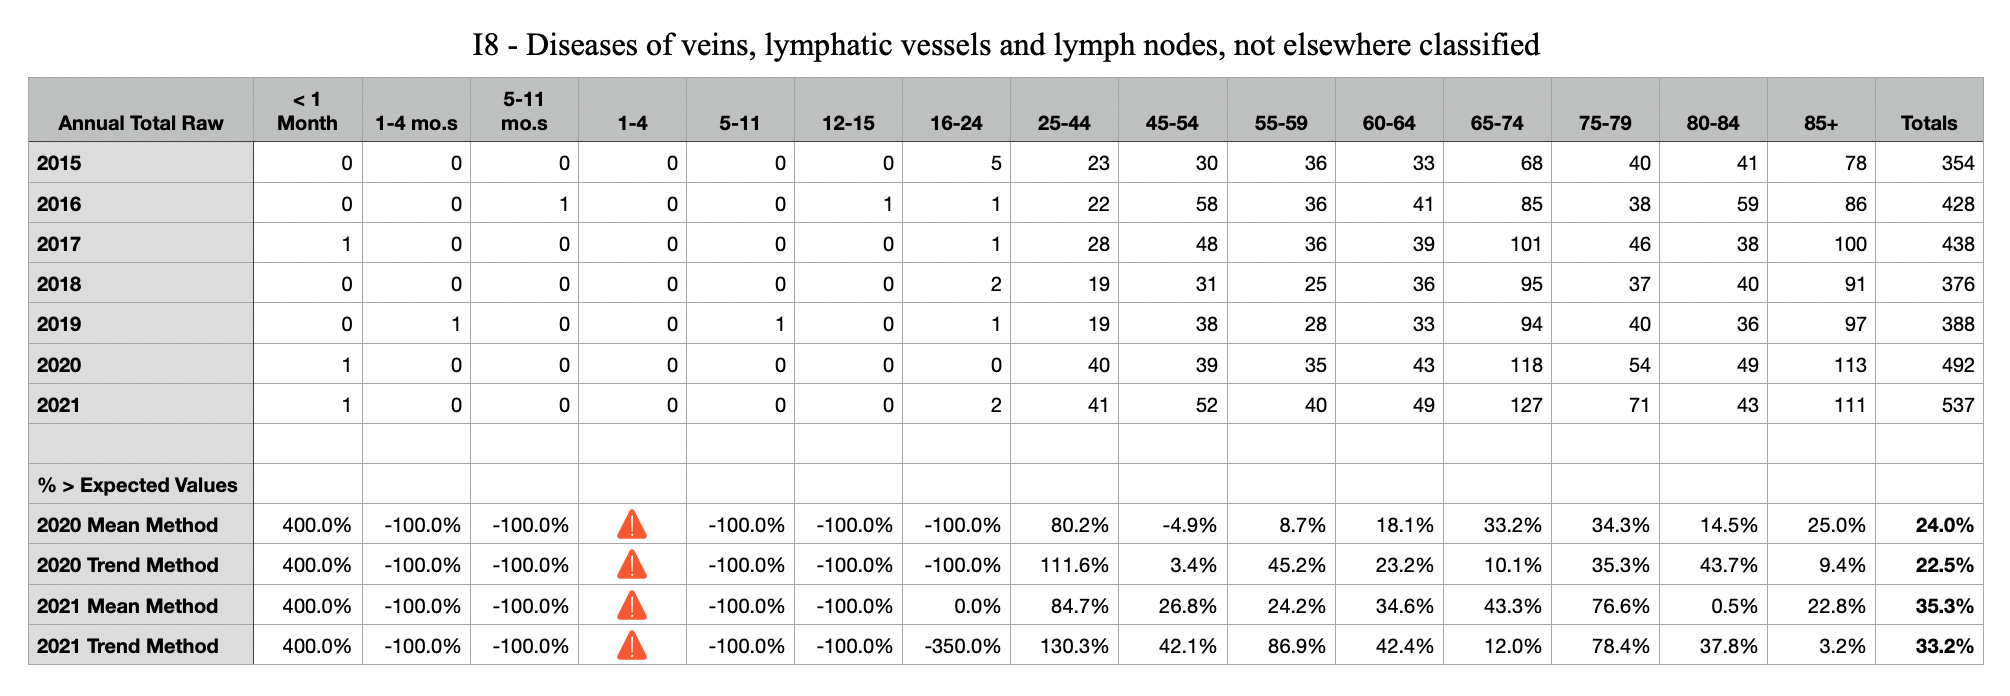
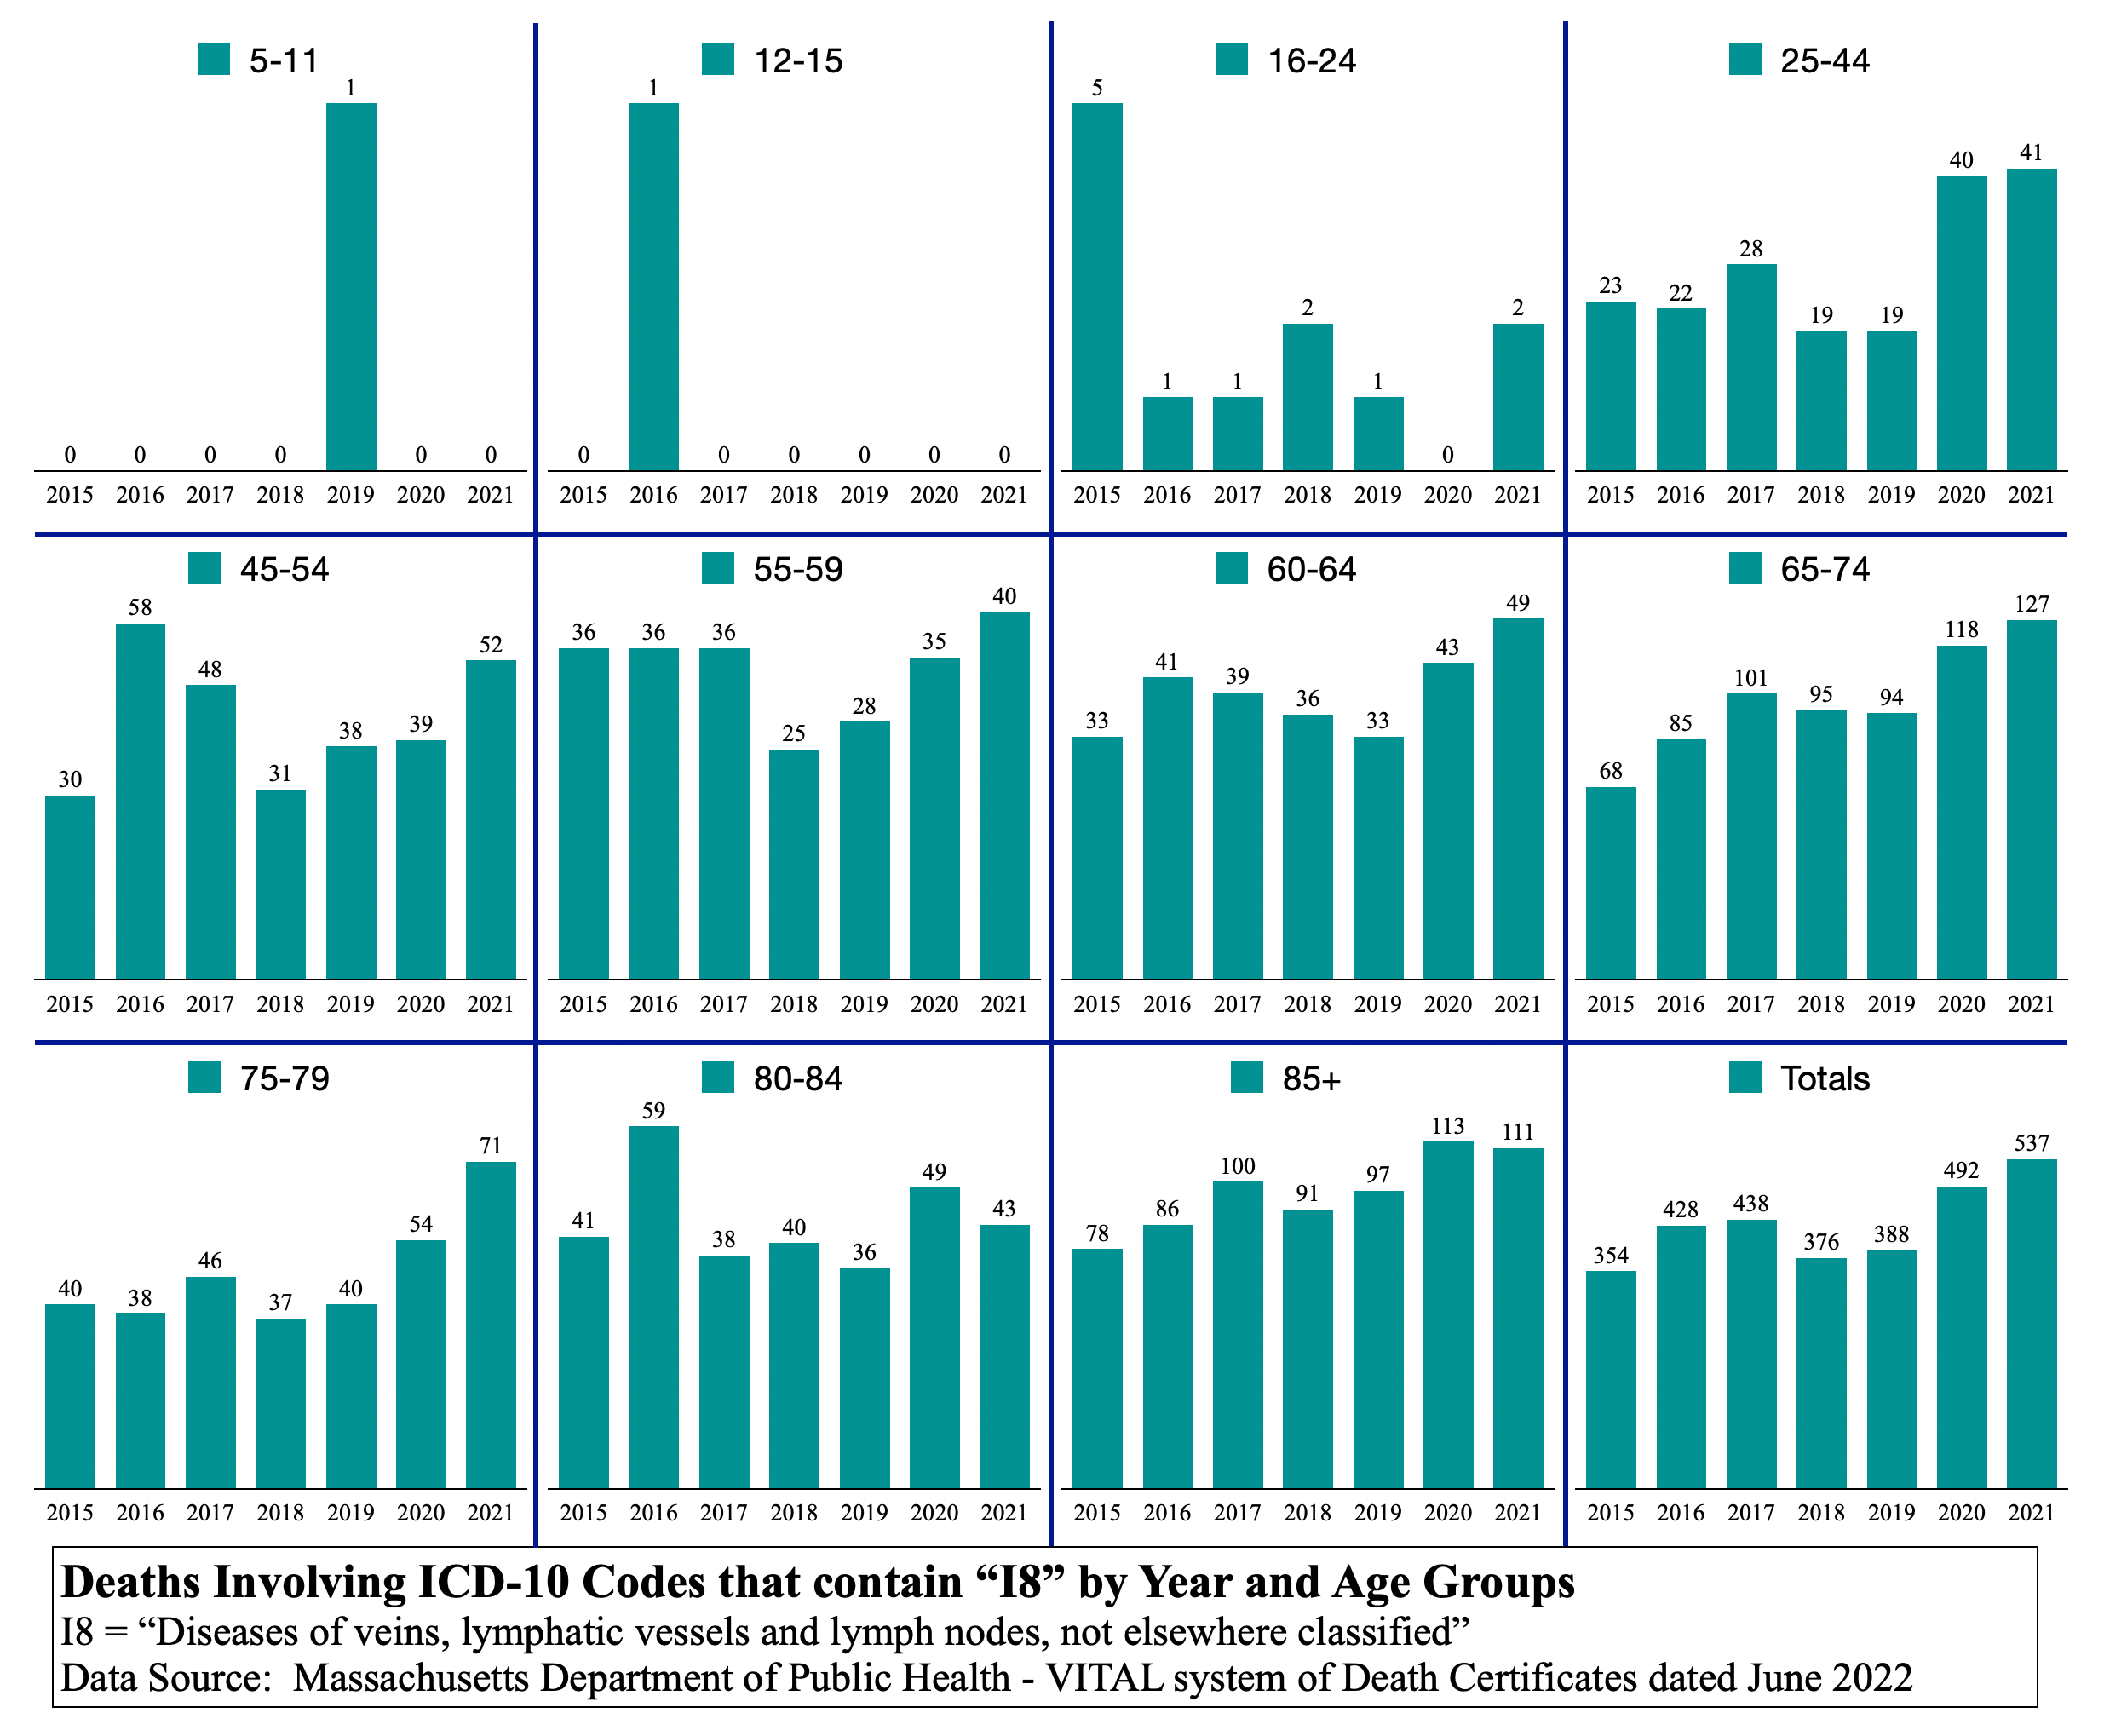
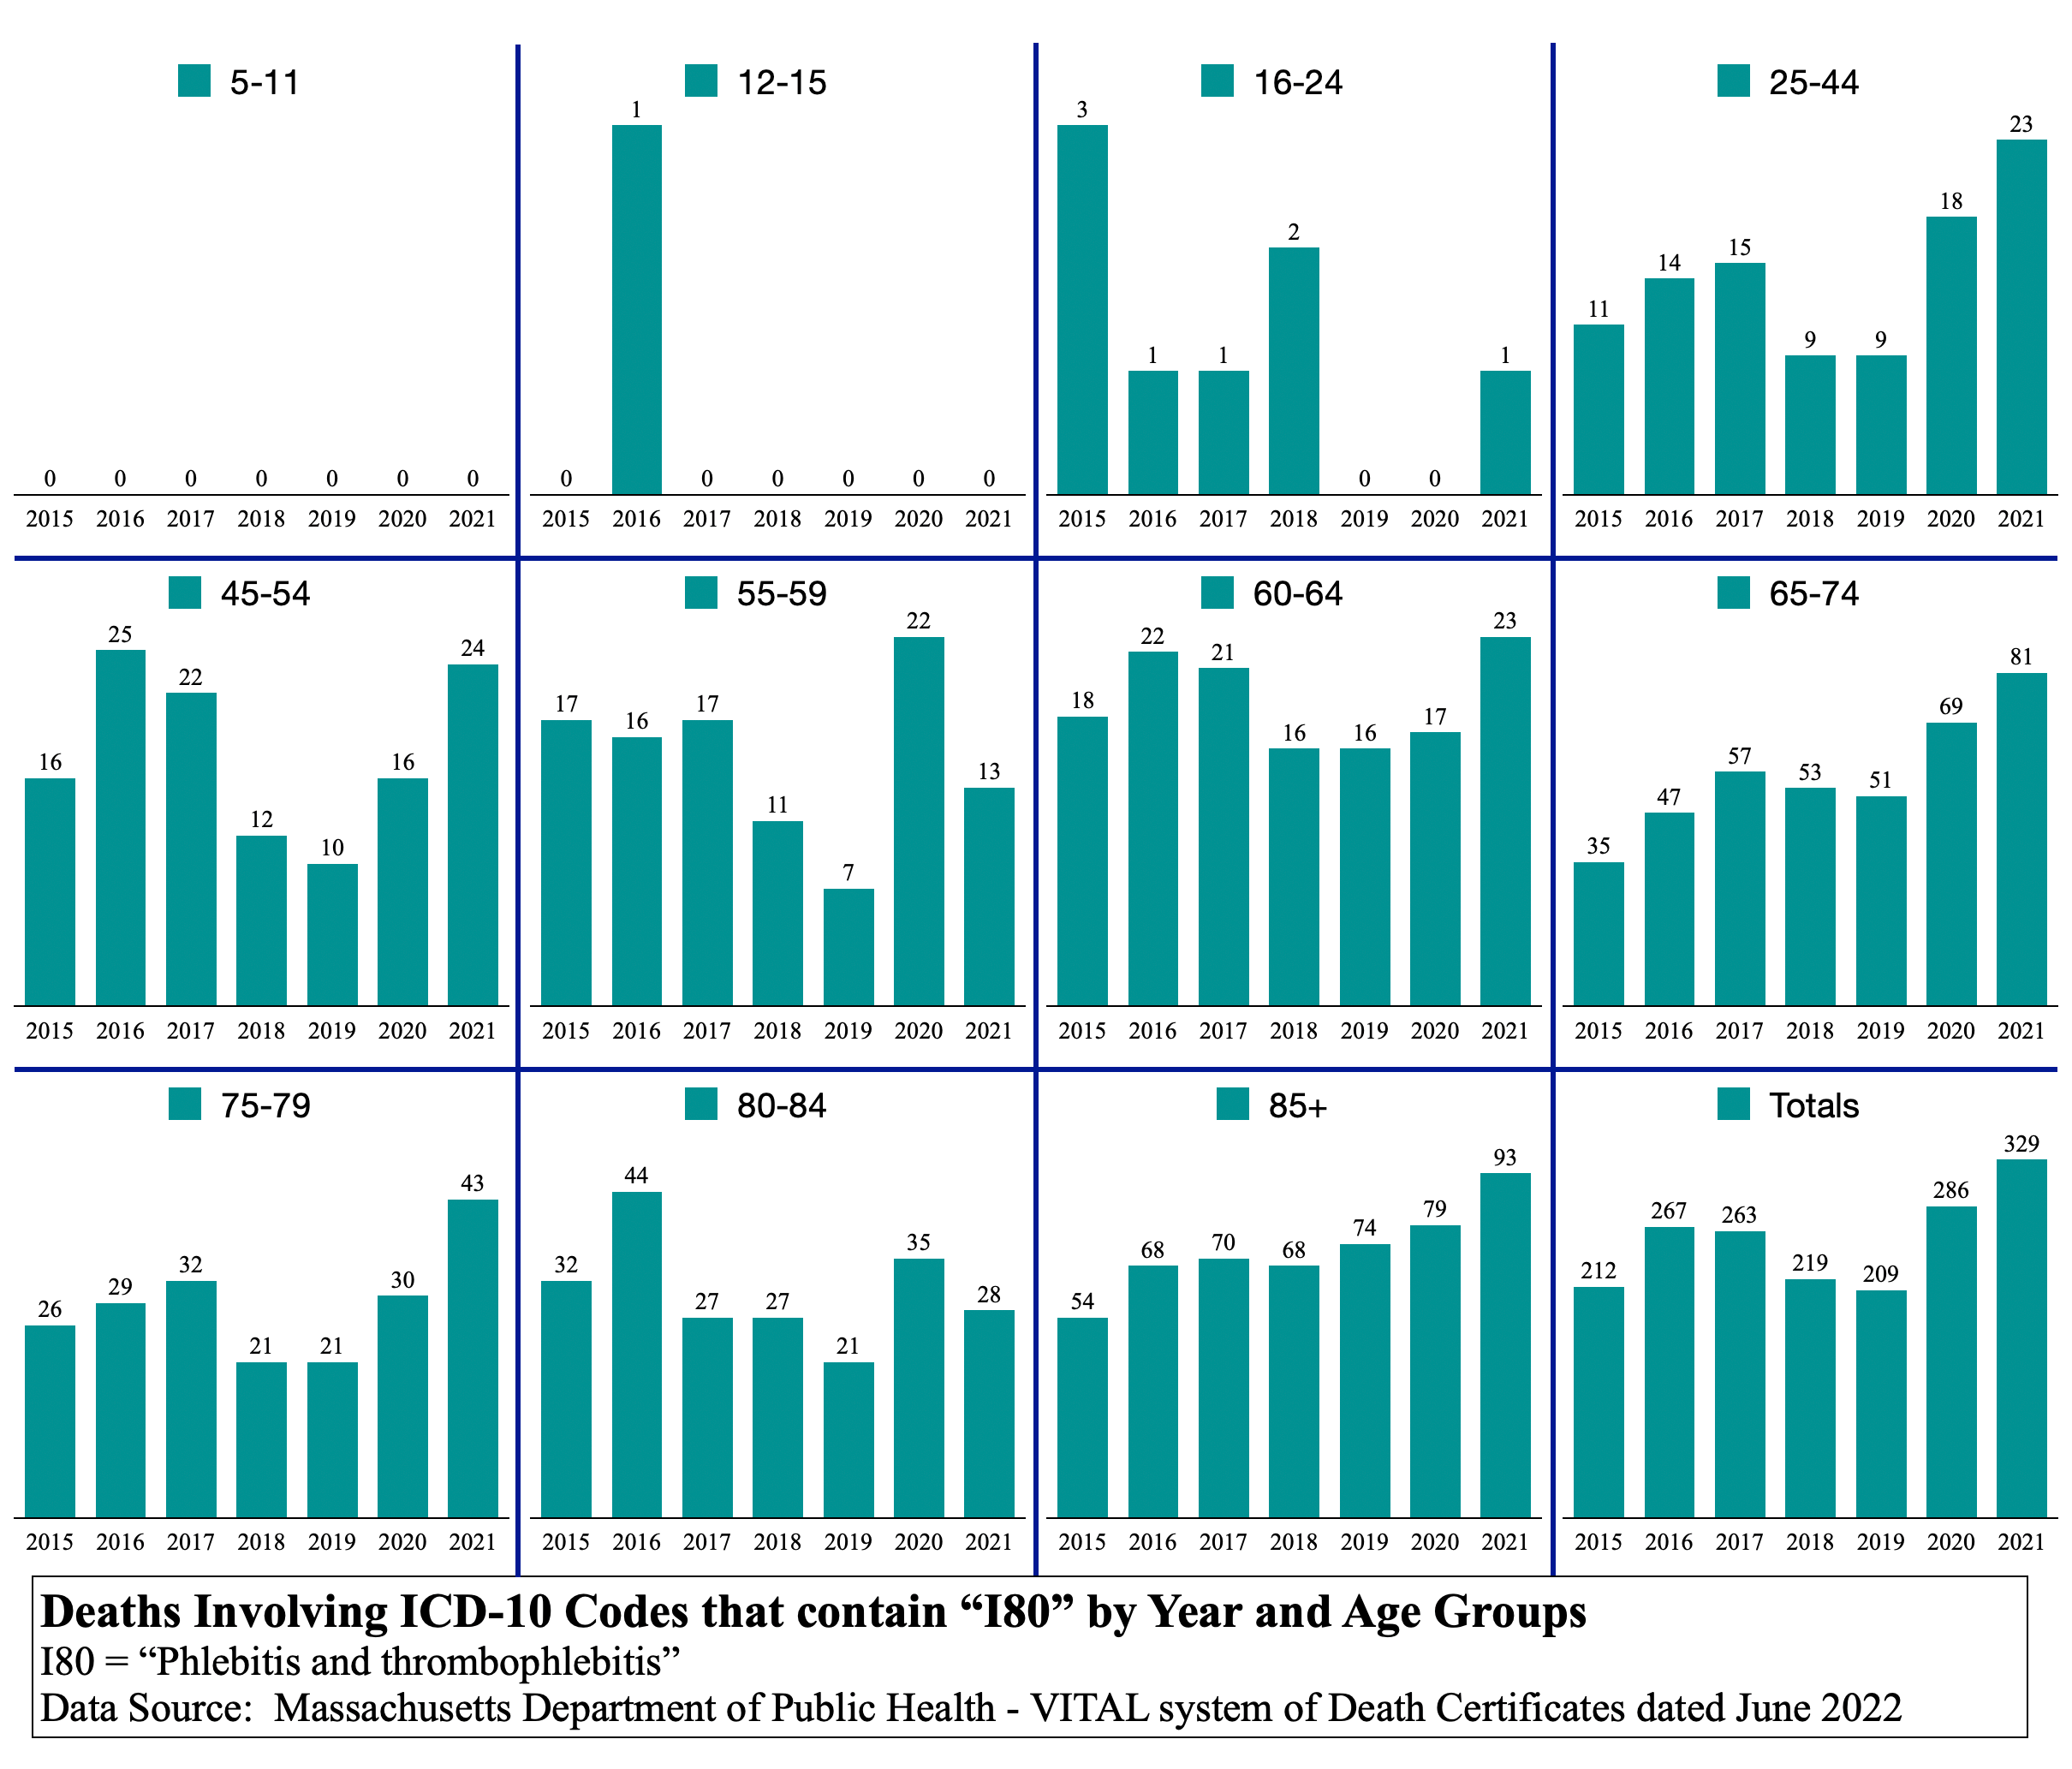
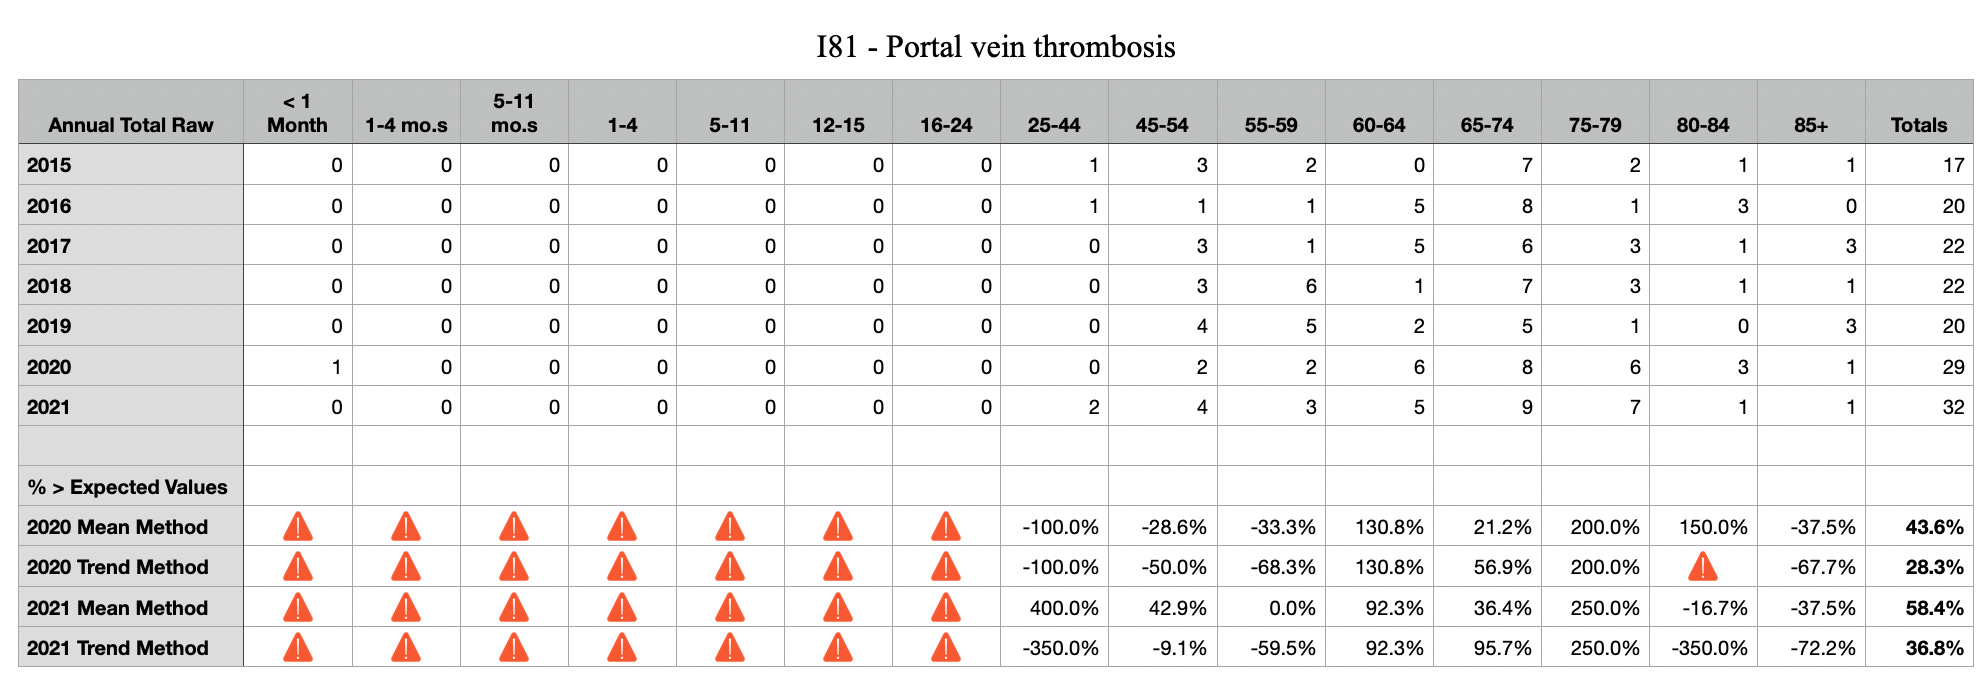
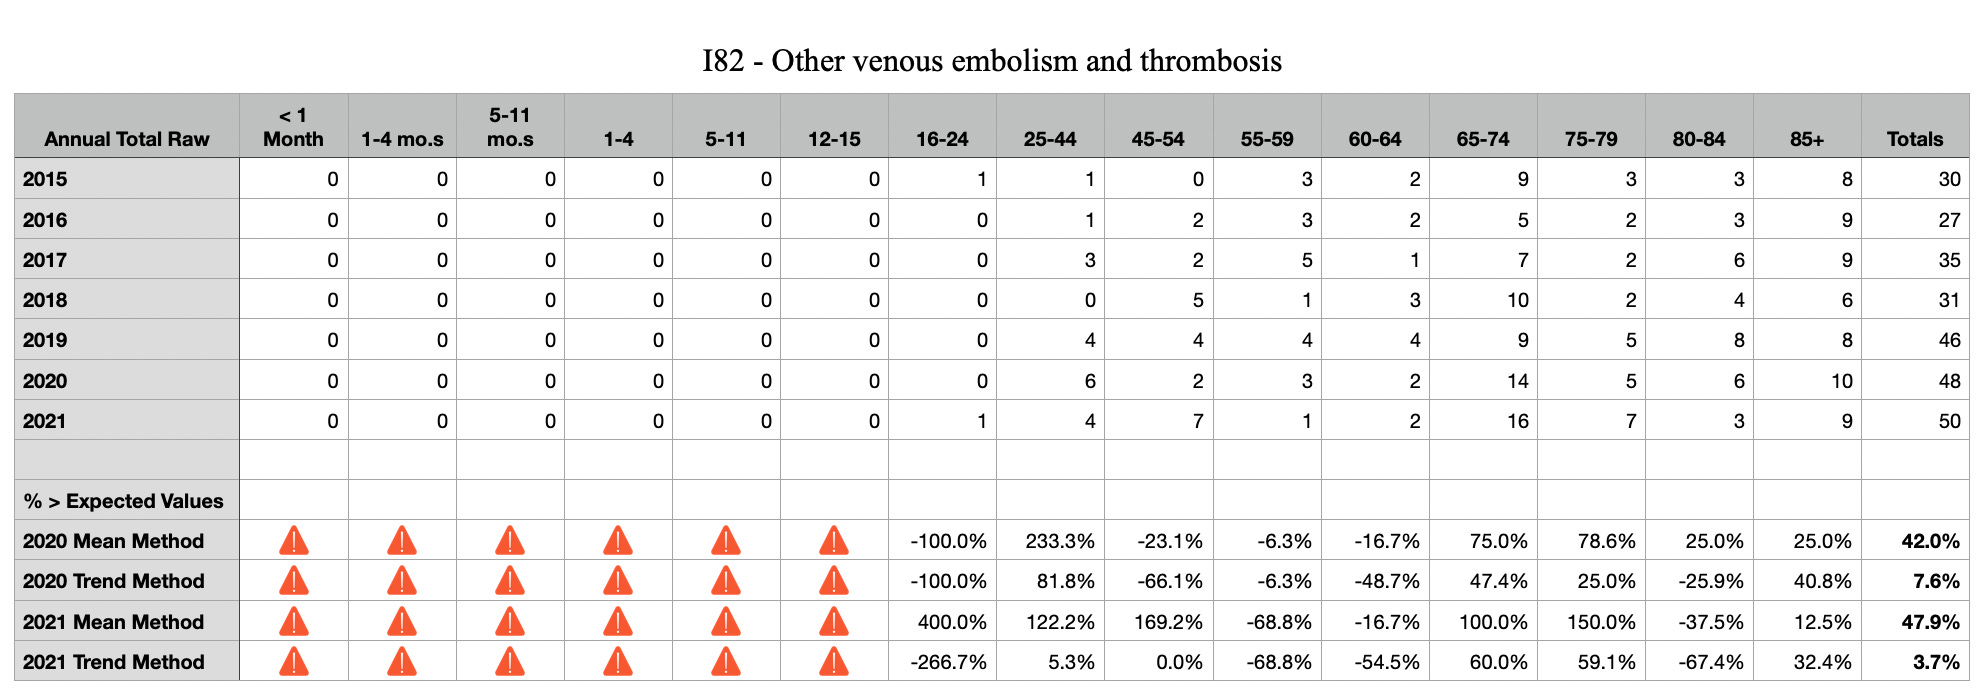
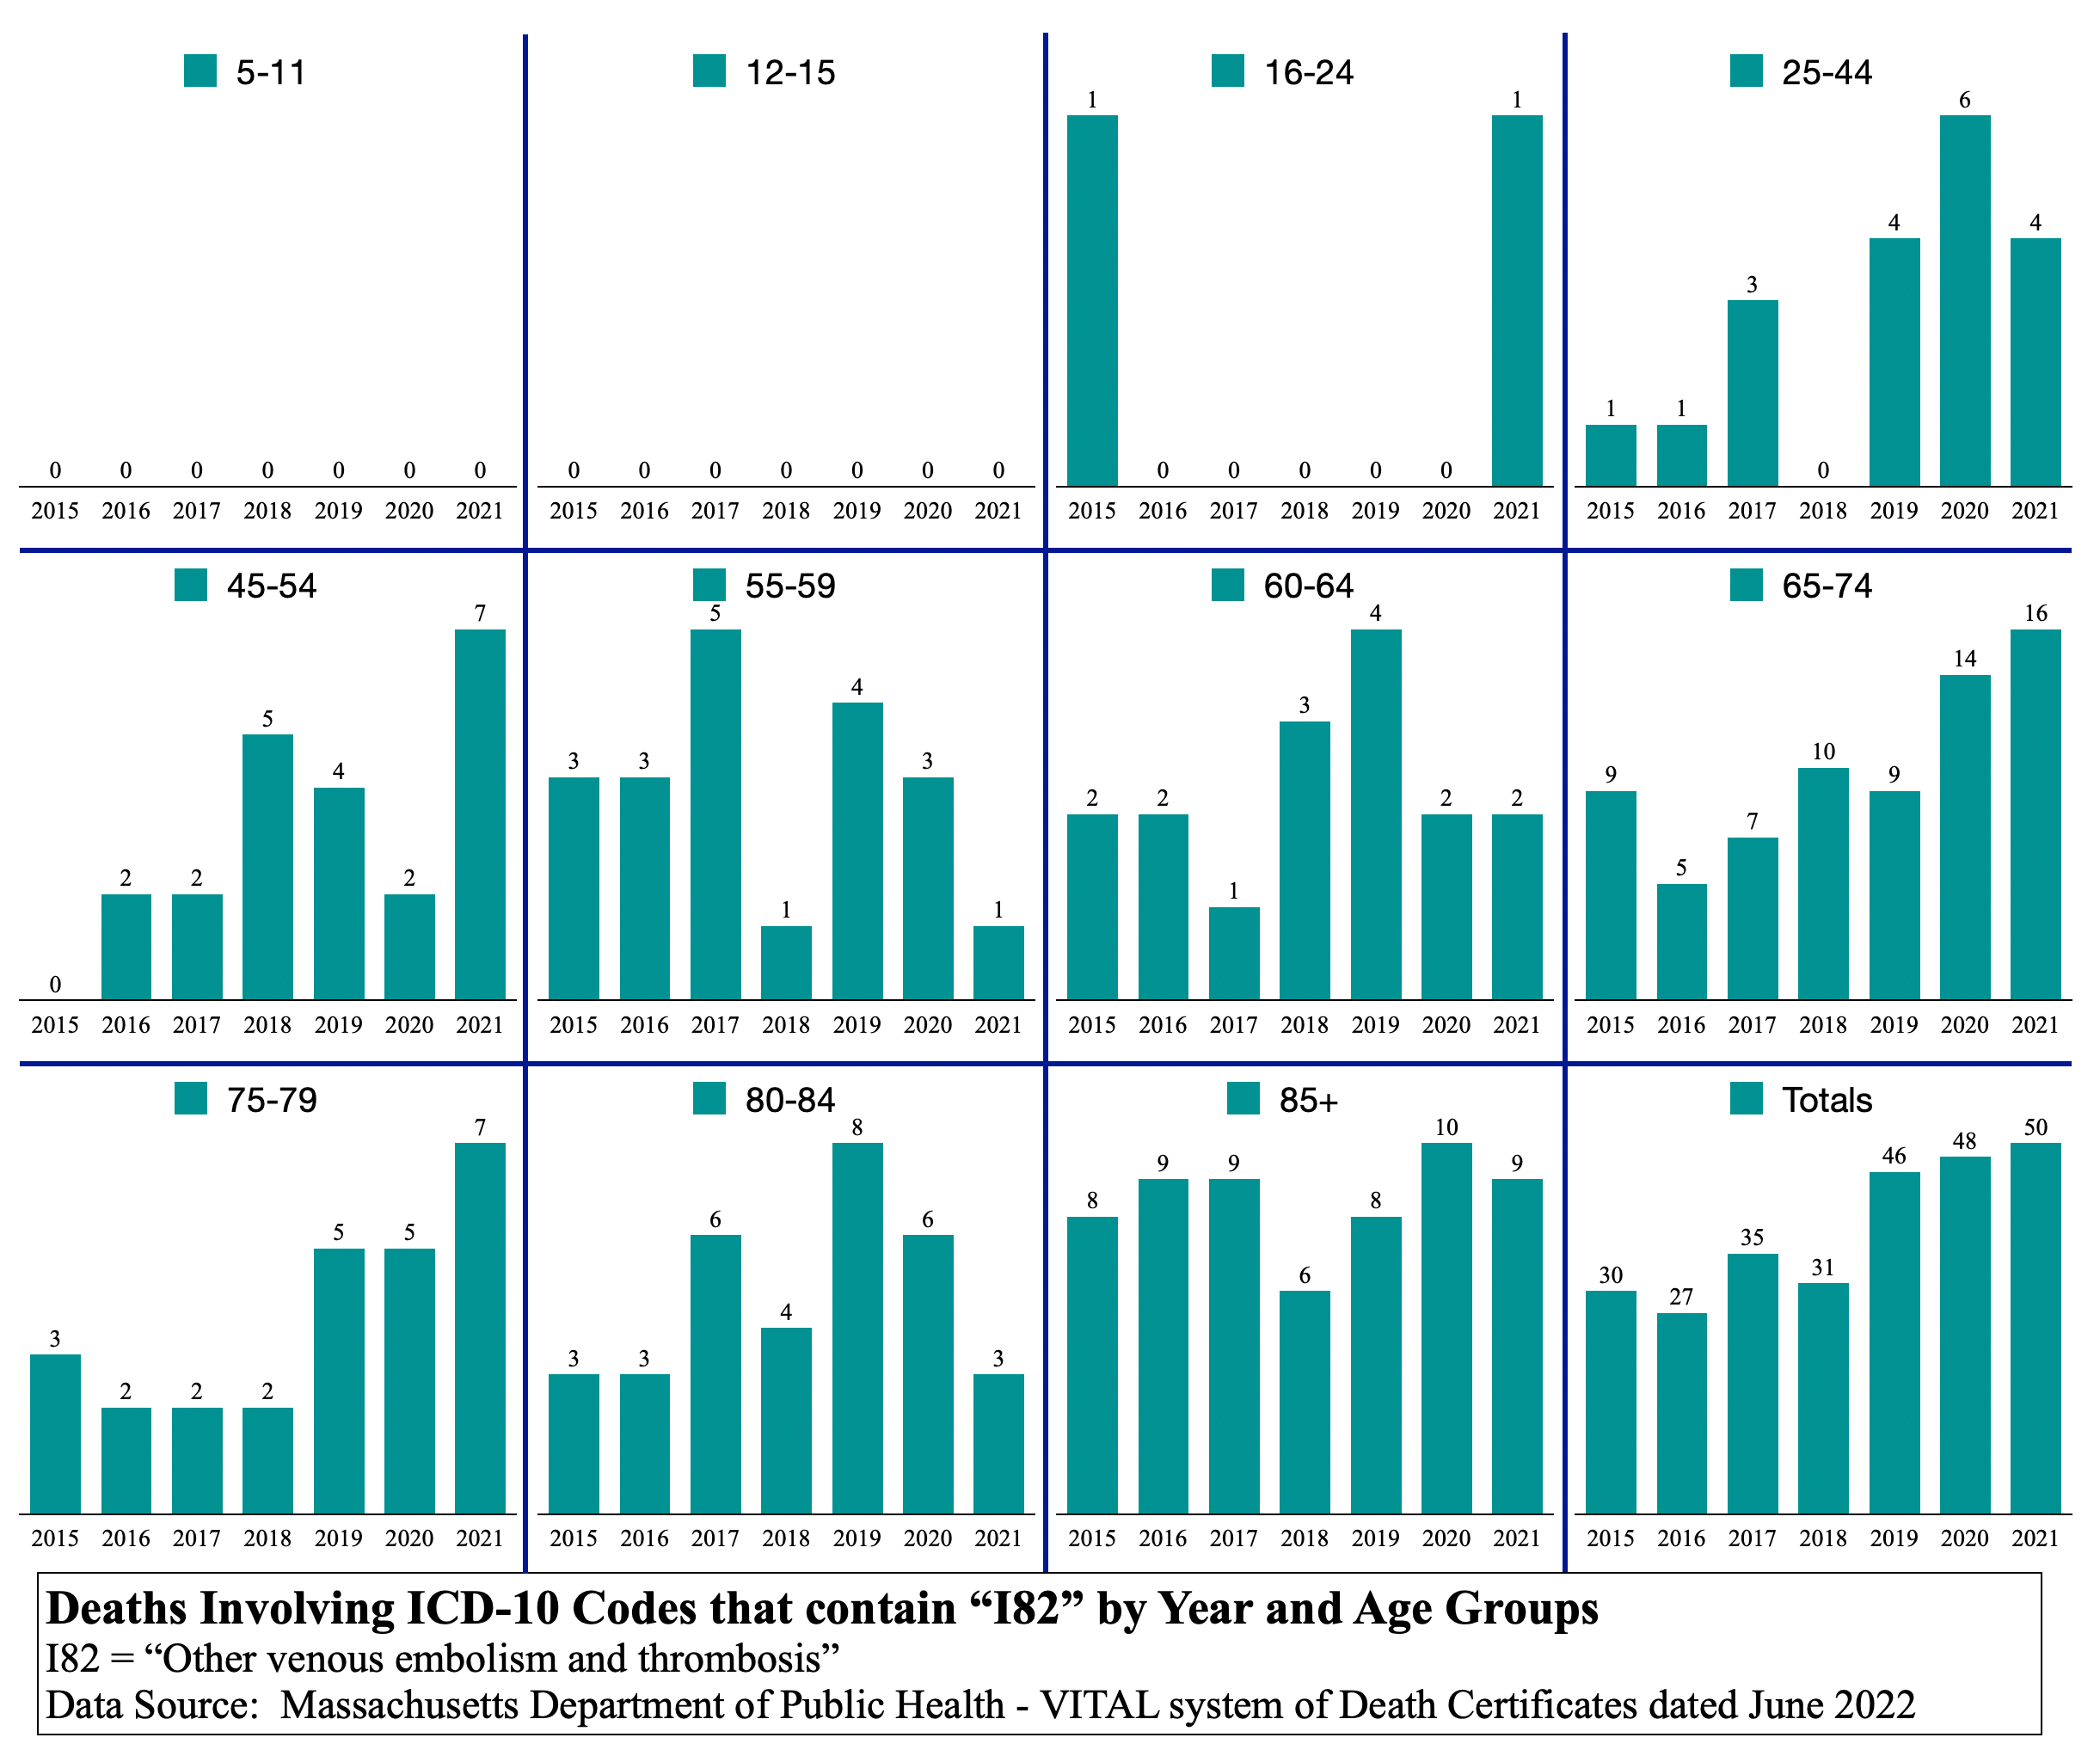
I8 Diseases of veins, lymphatic vessels …
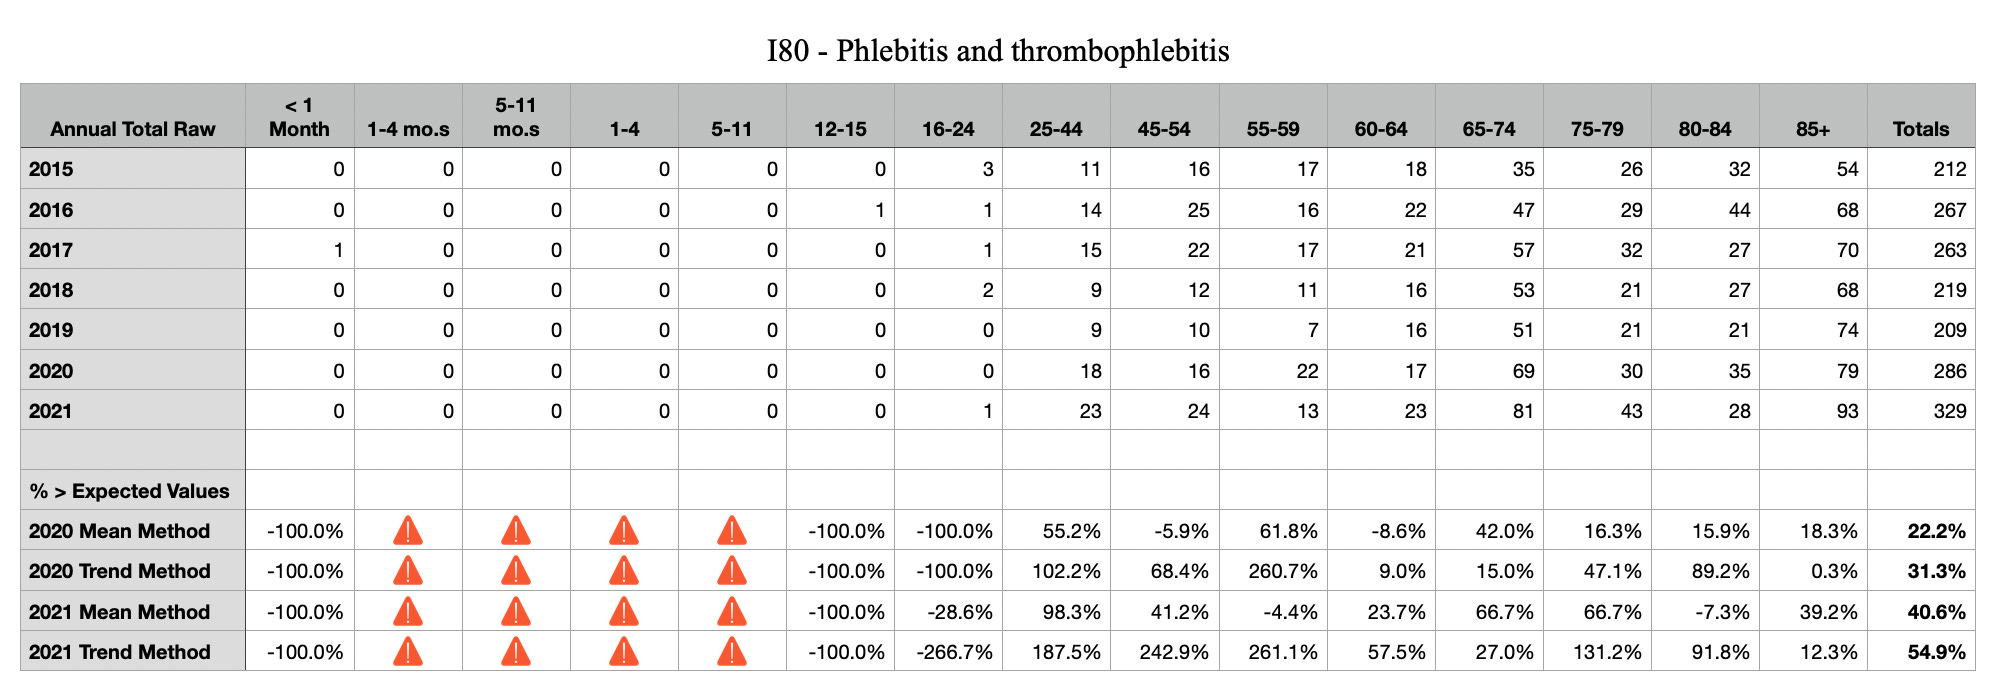
I80 Phelbitis and thrombophlebitis
I81 Portal vein thrombosis

I82 Other venous embolism and thrombosis
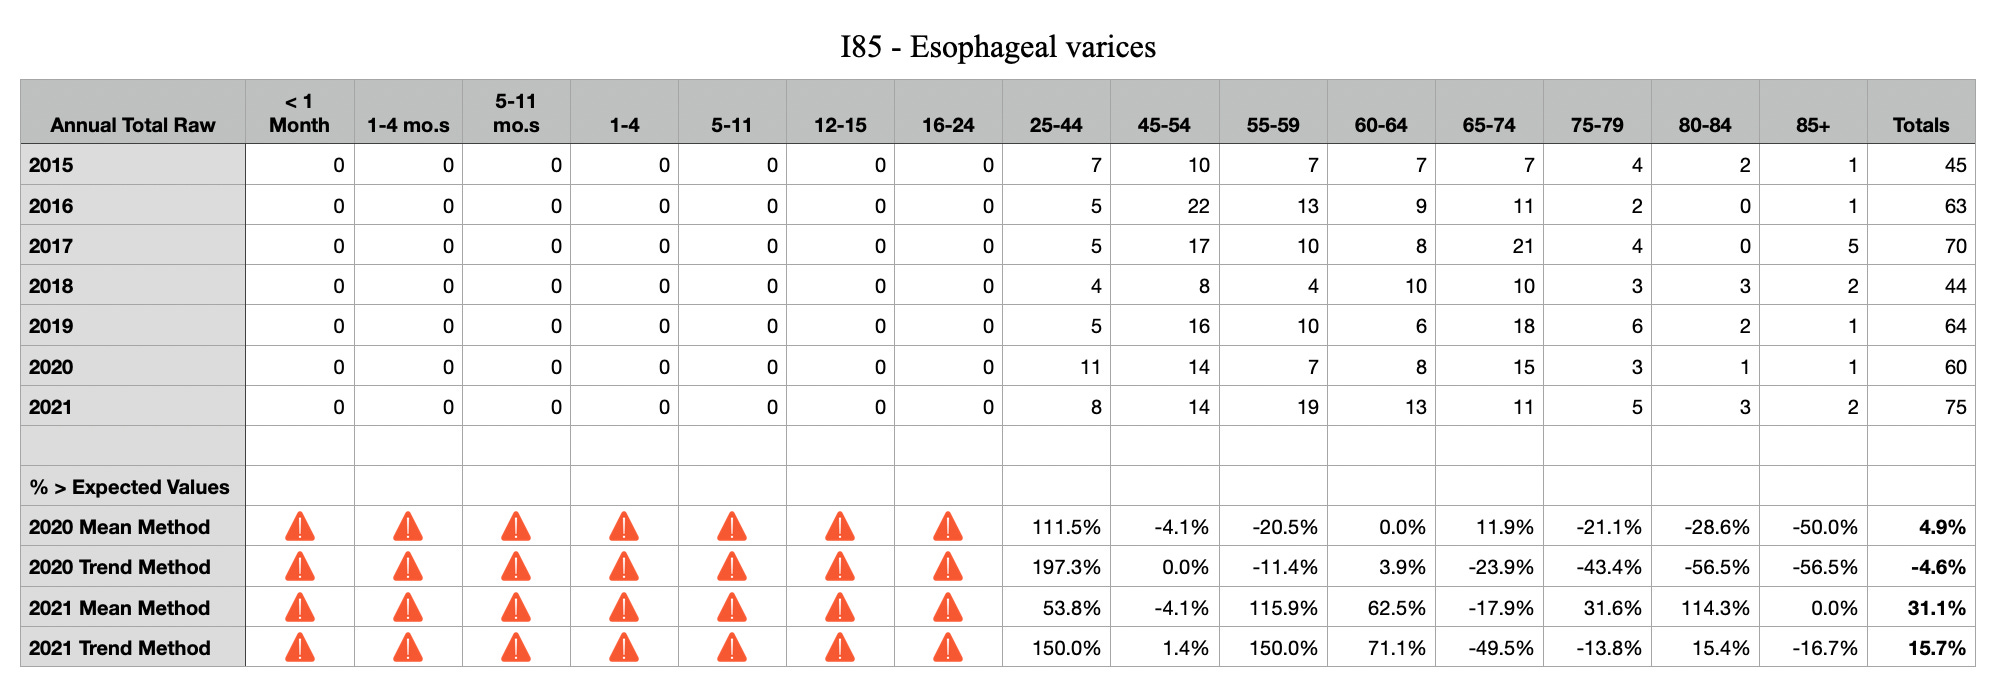
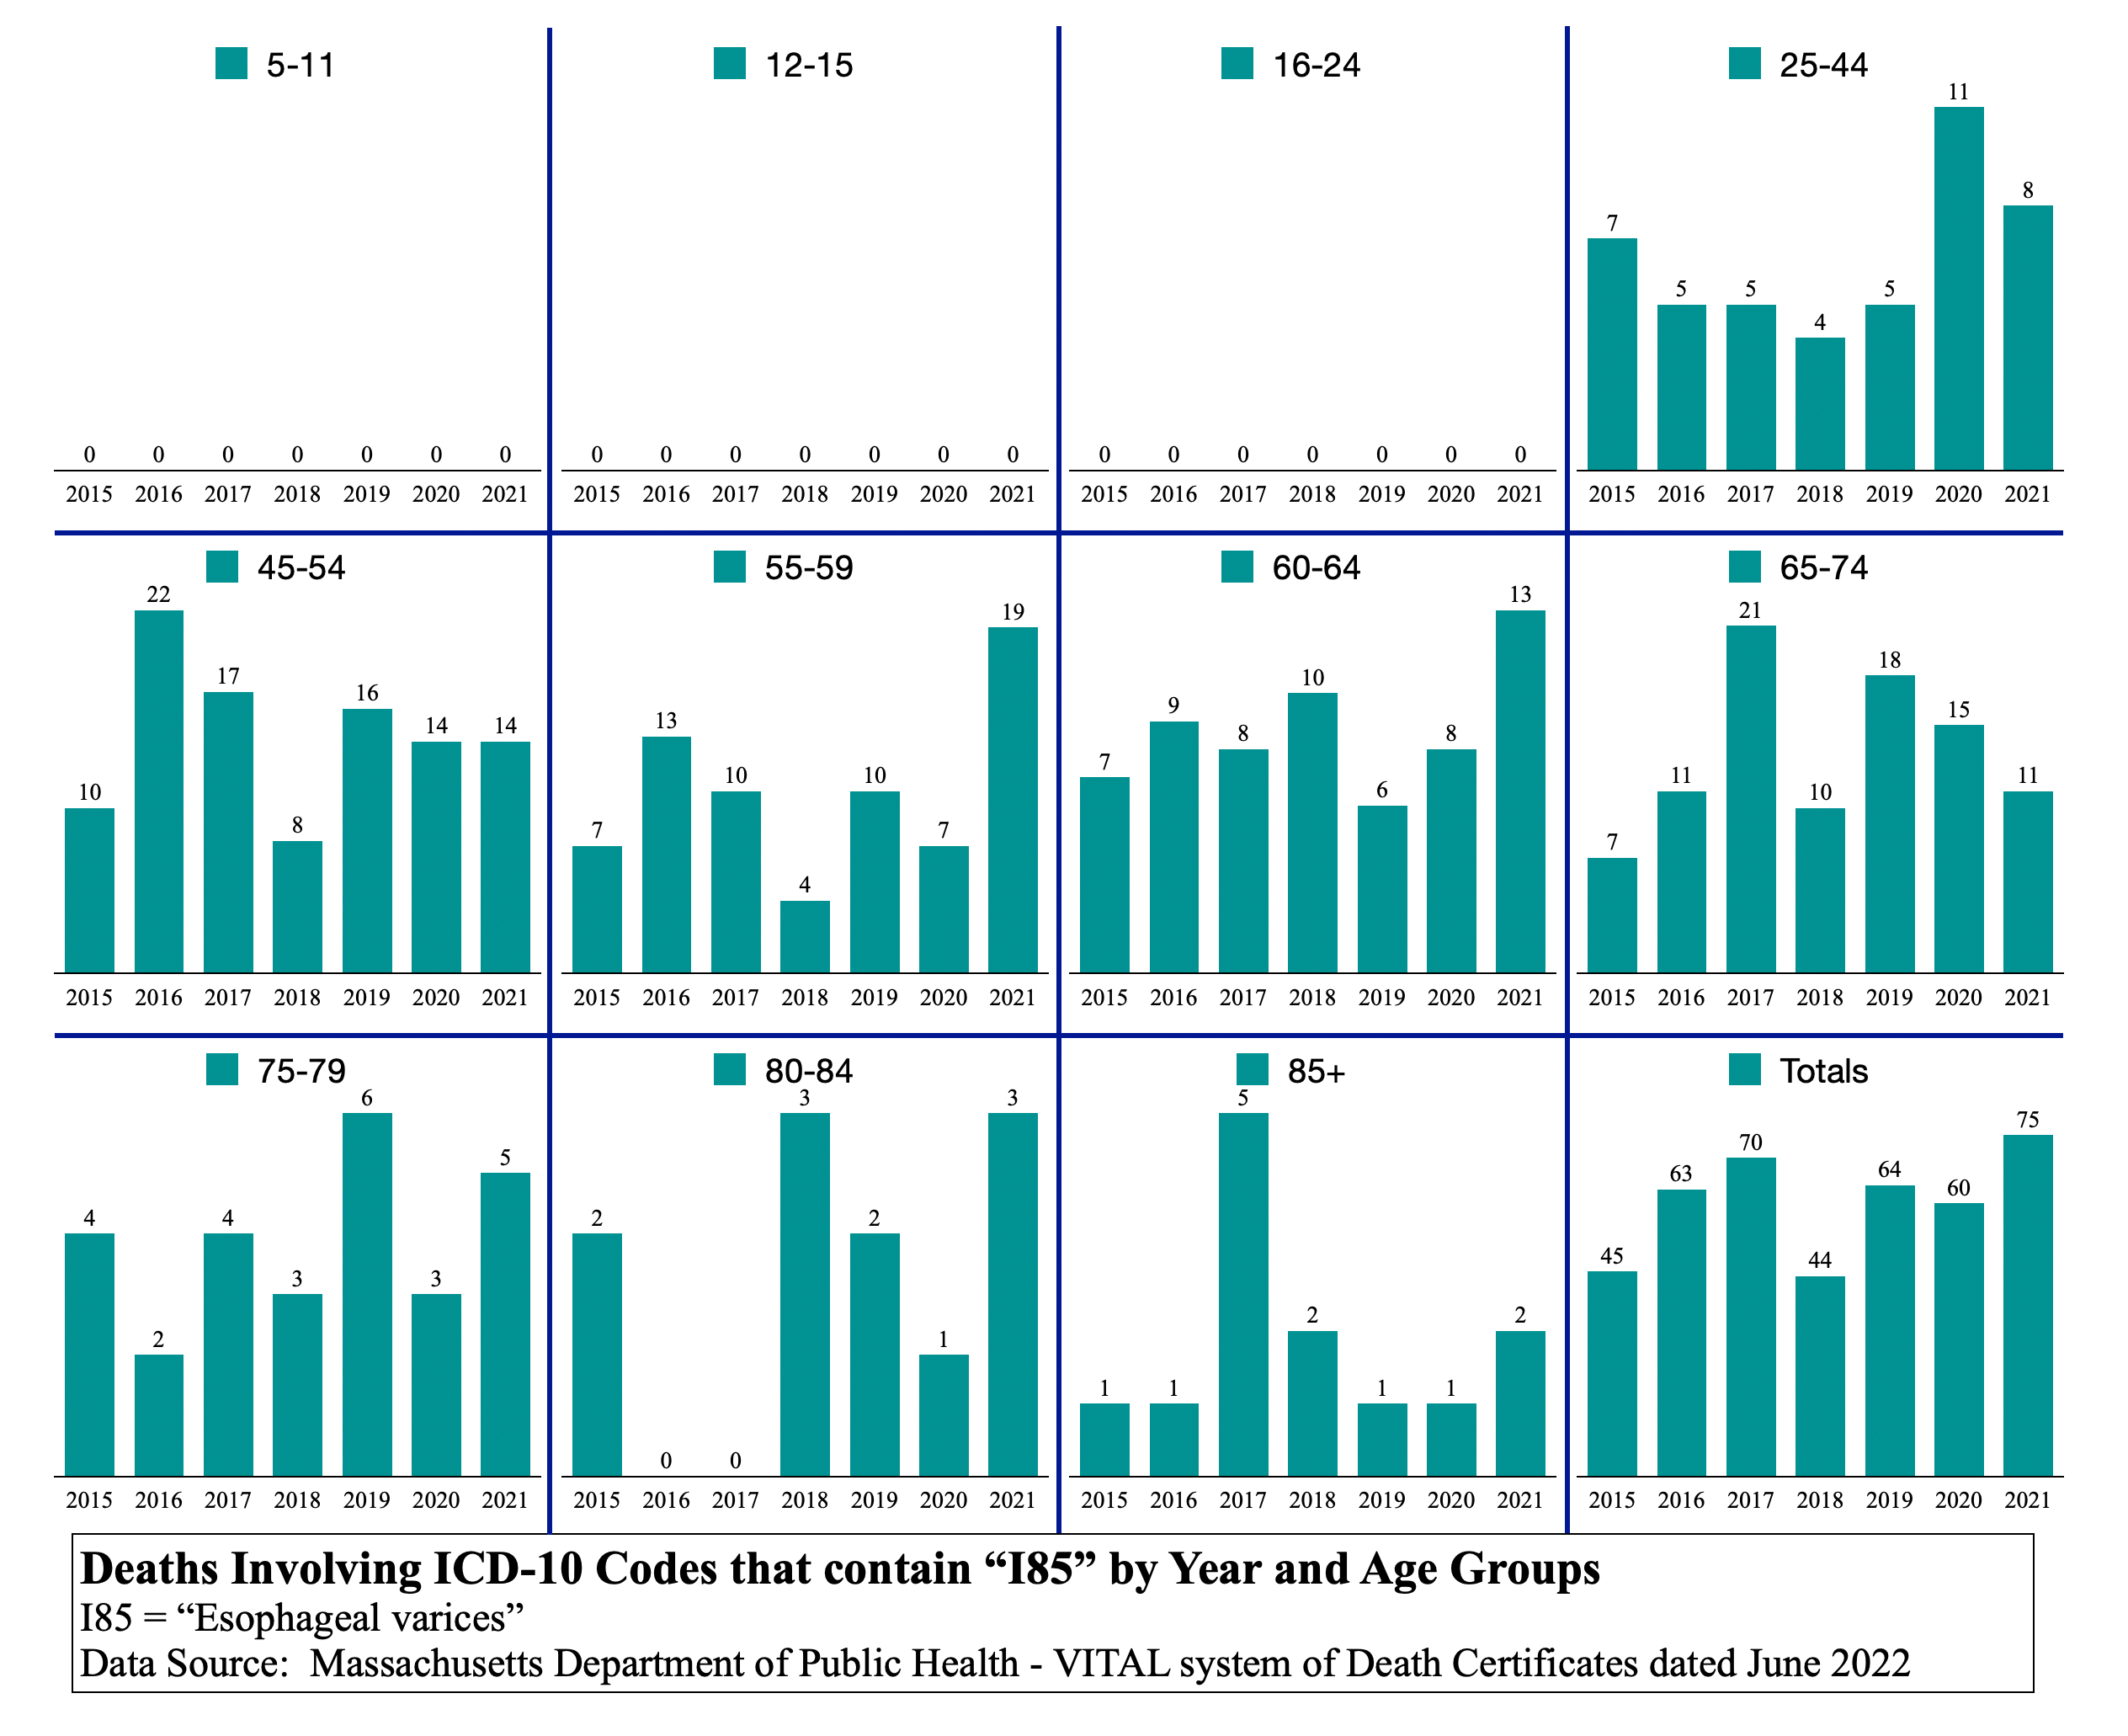
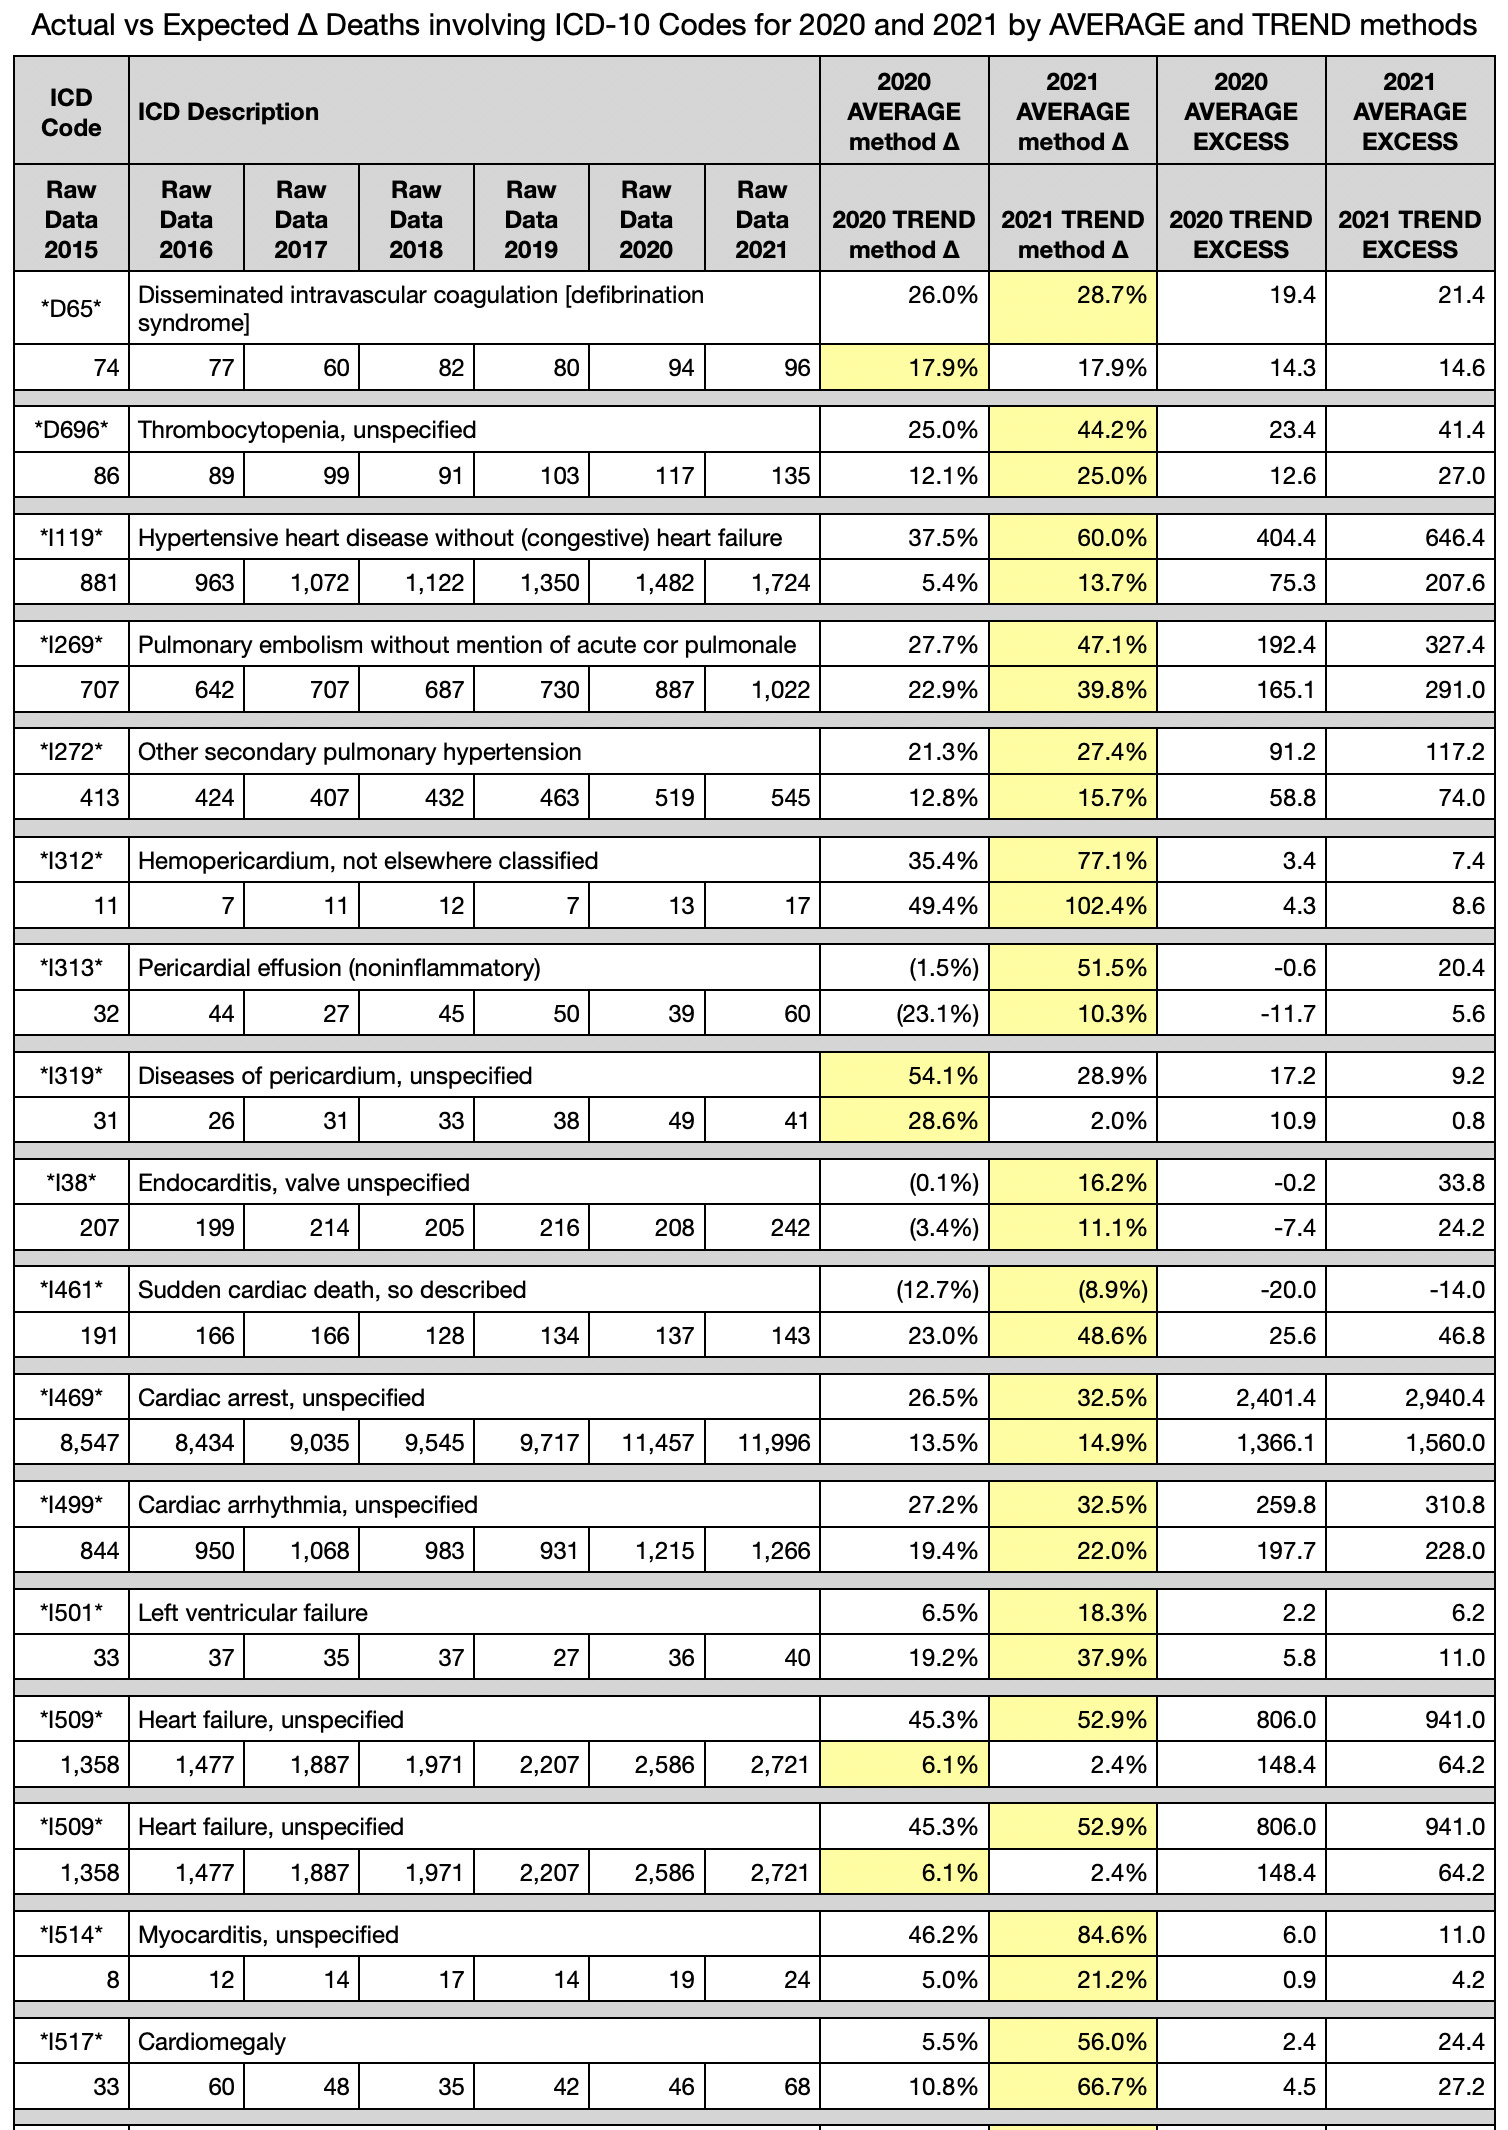
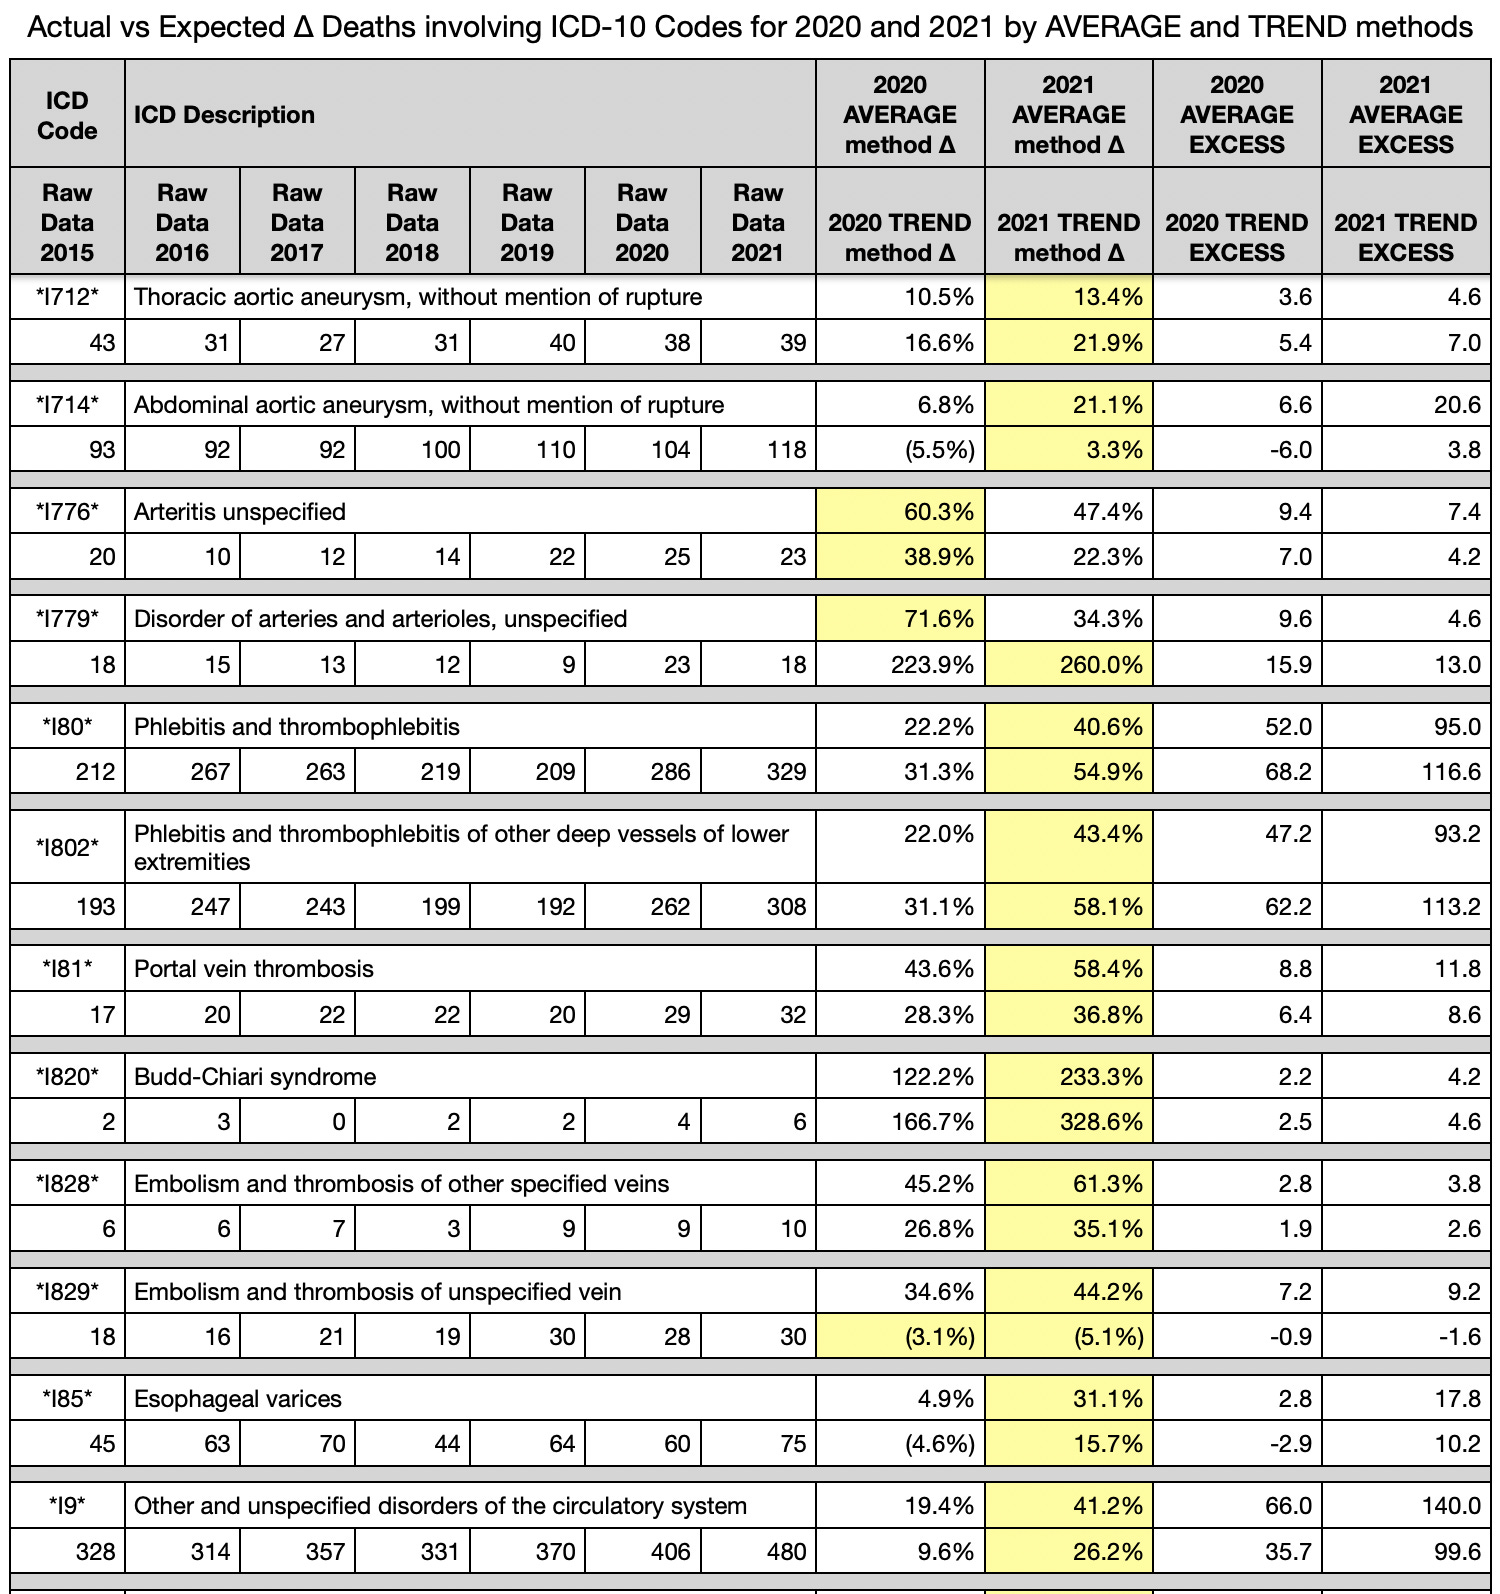
I85 Esophageal varices
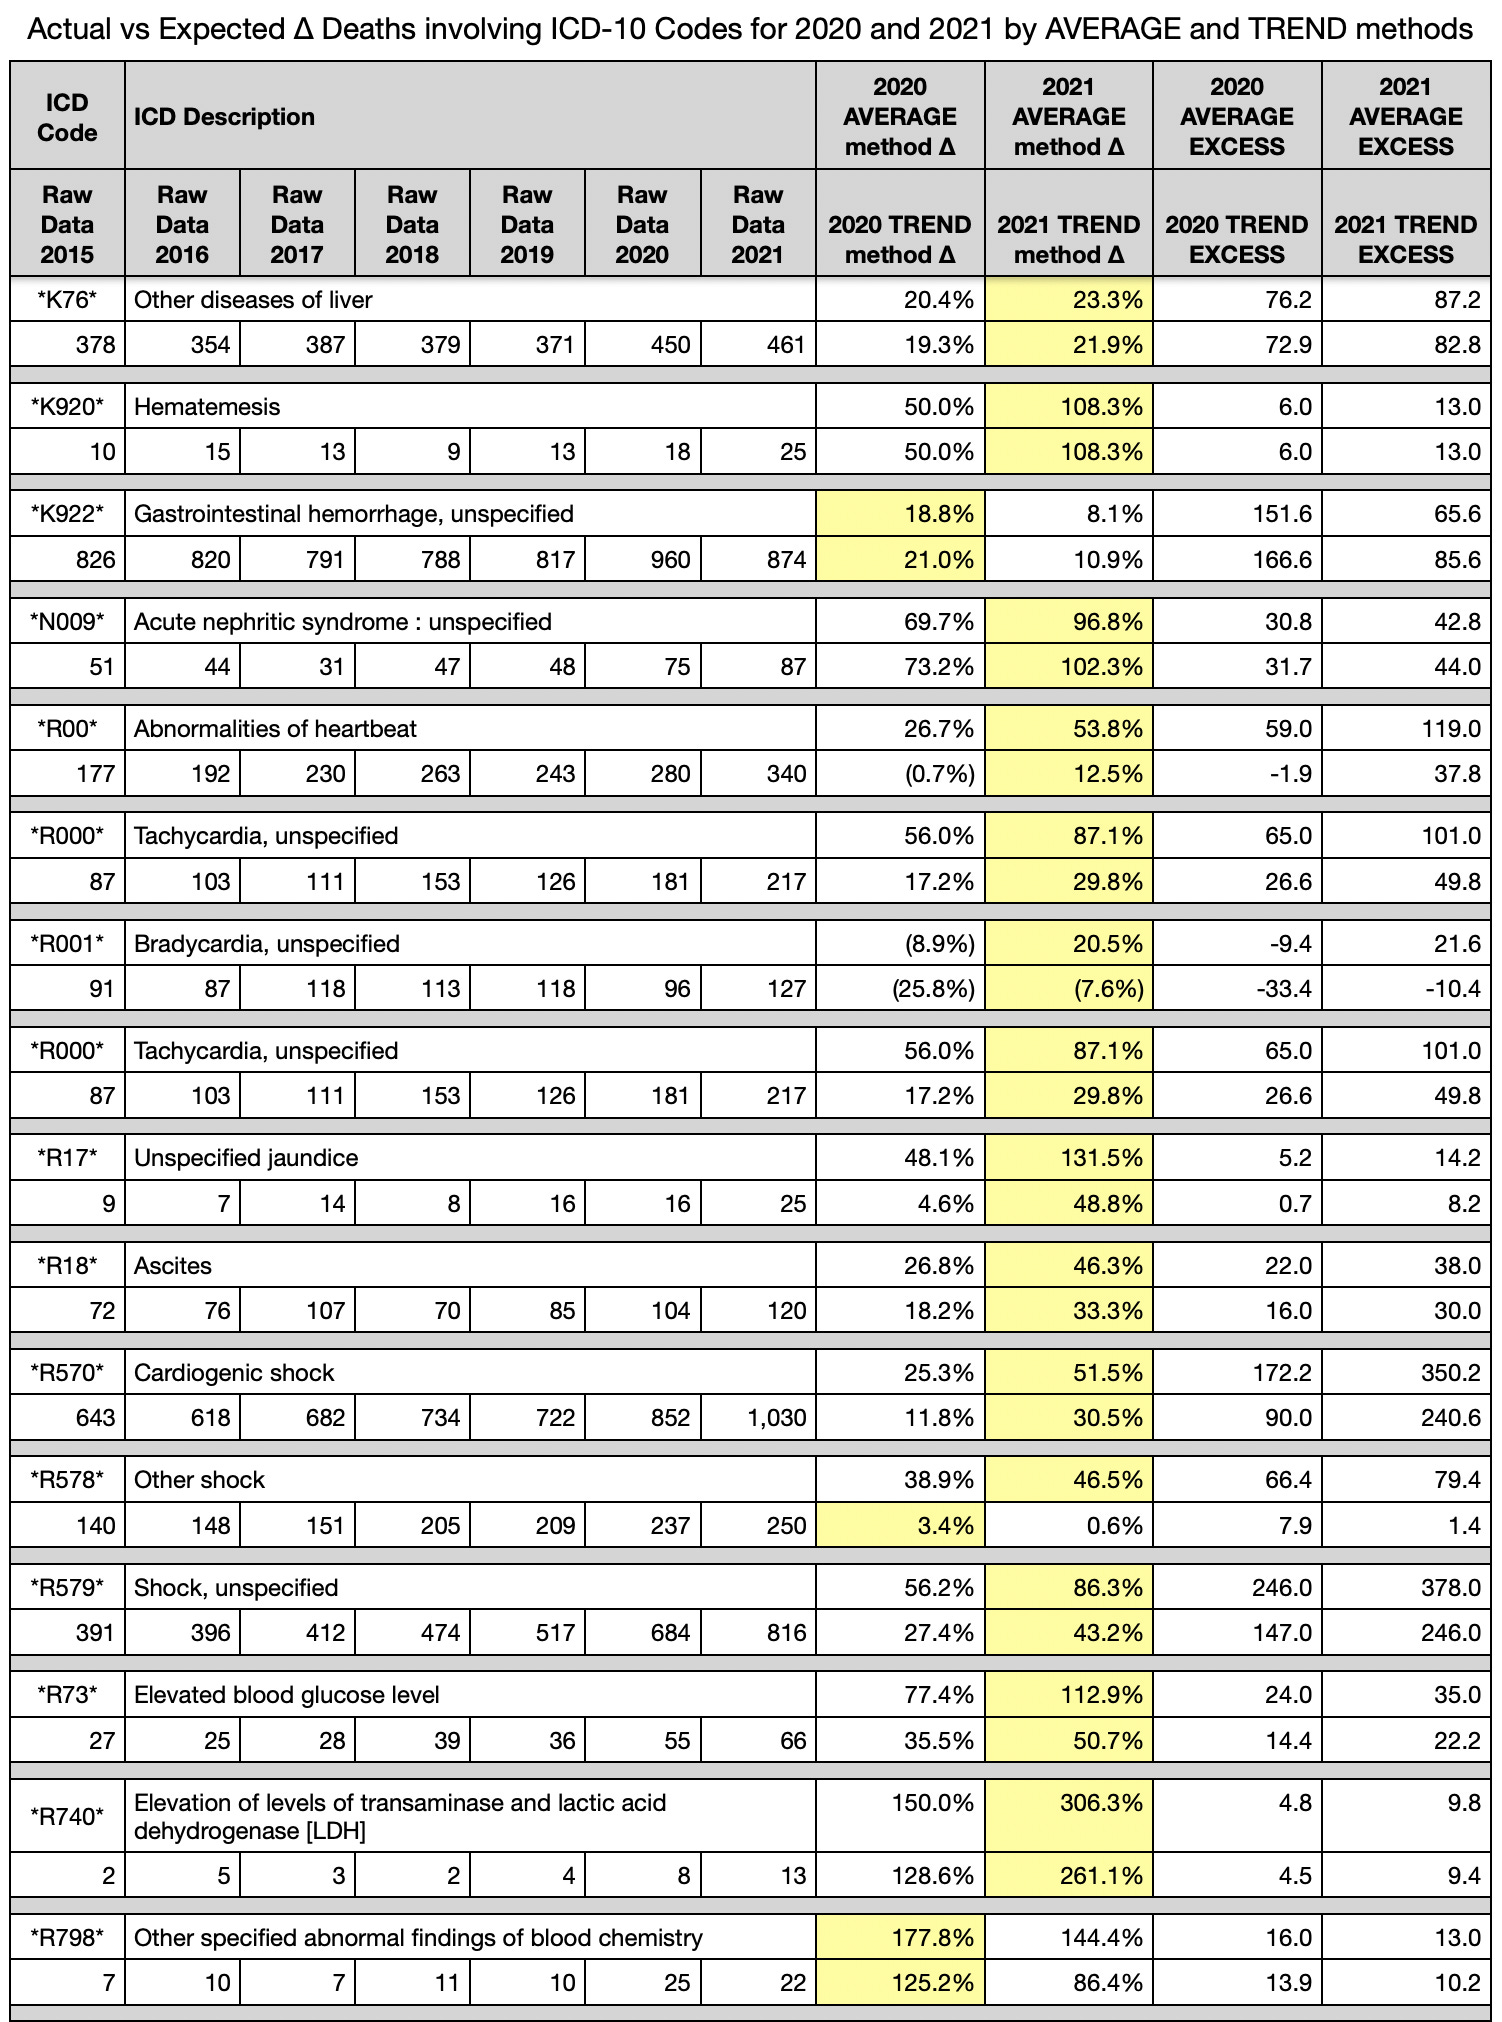
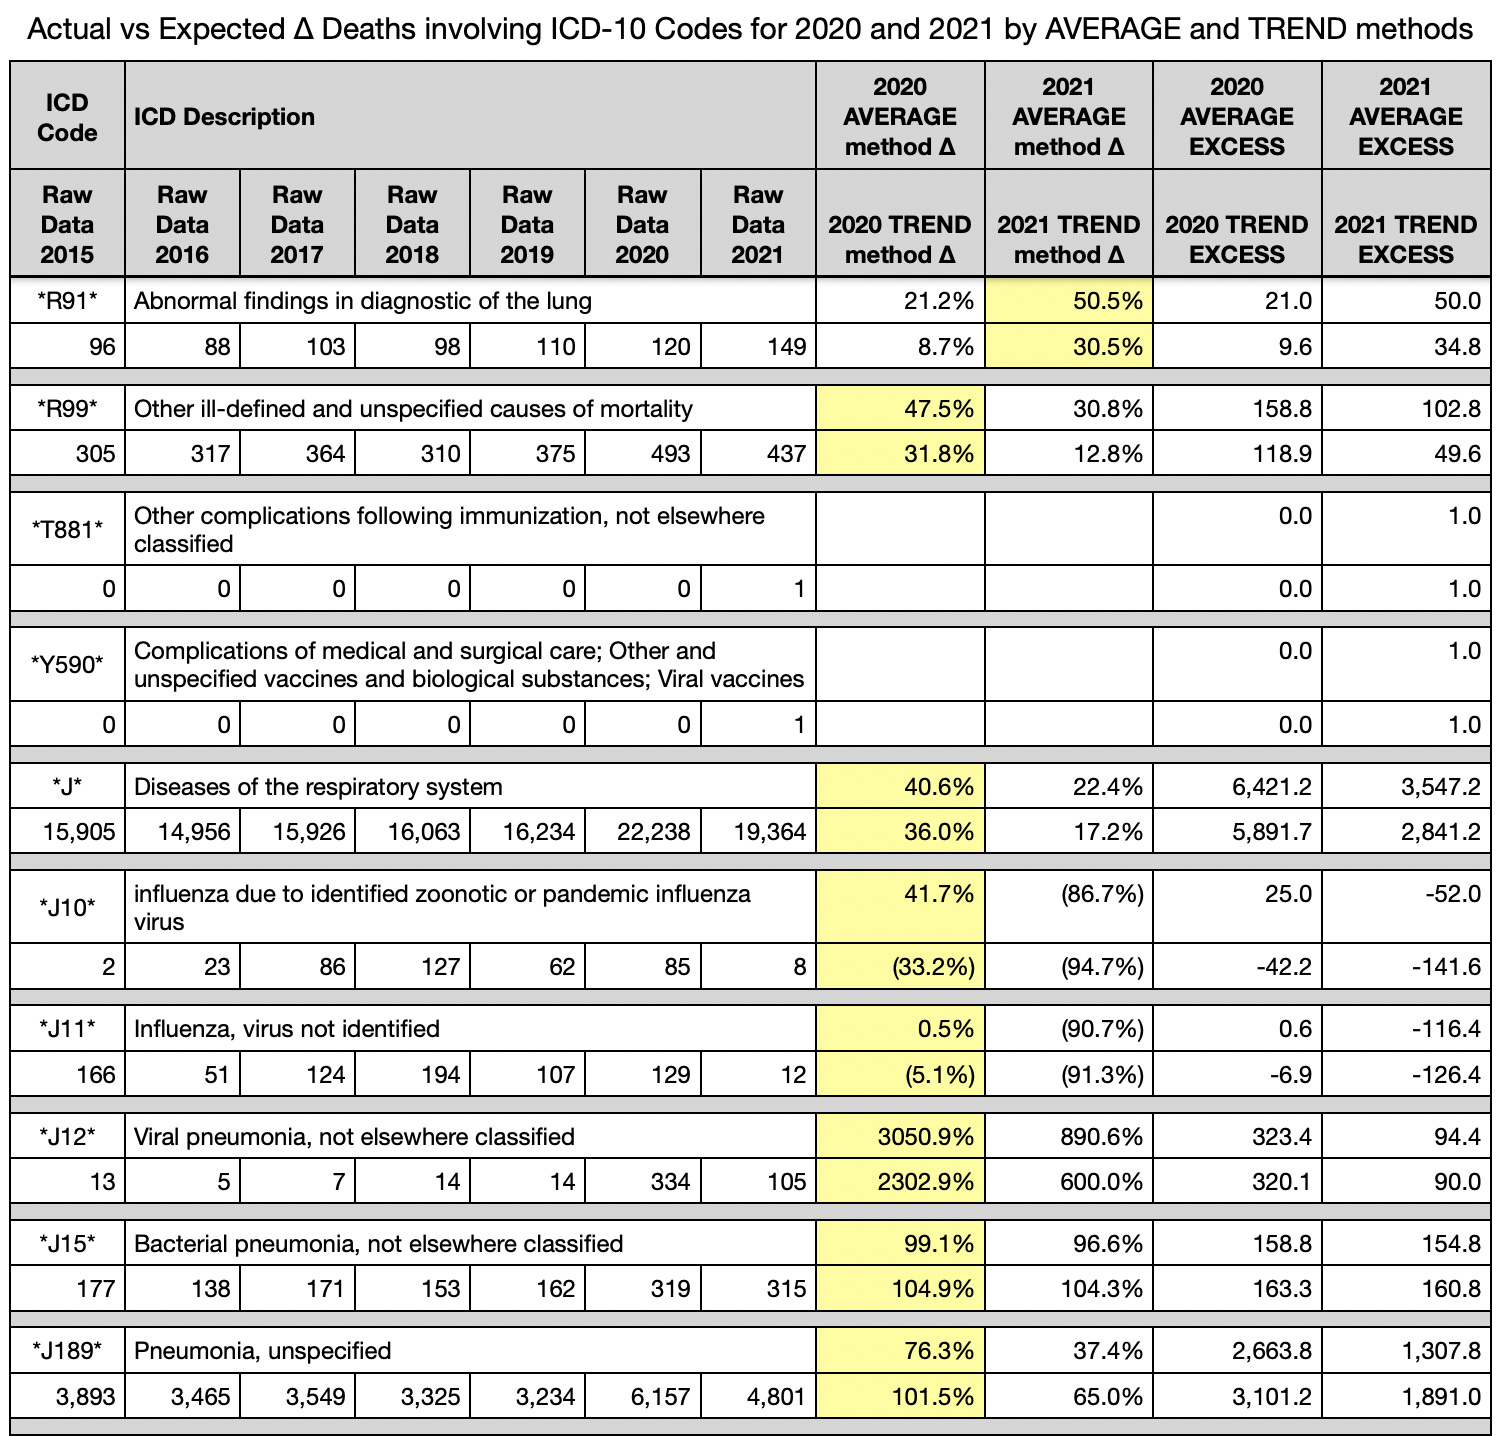
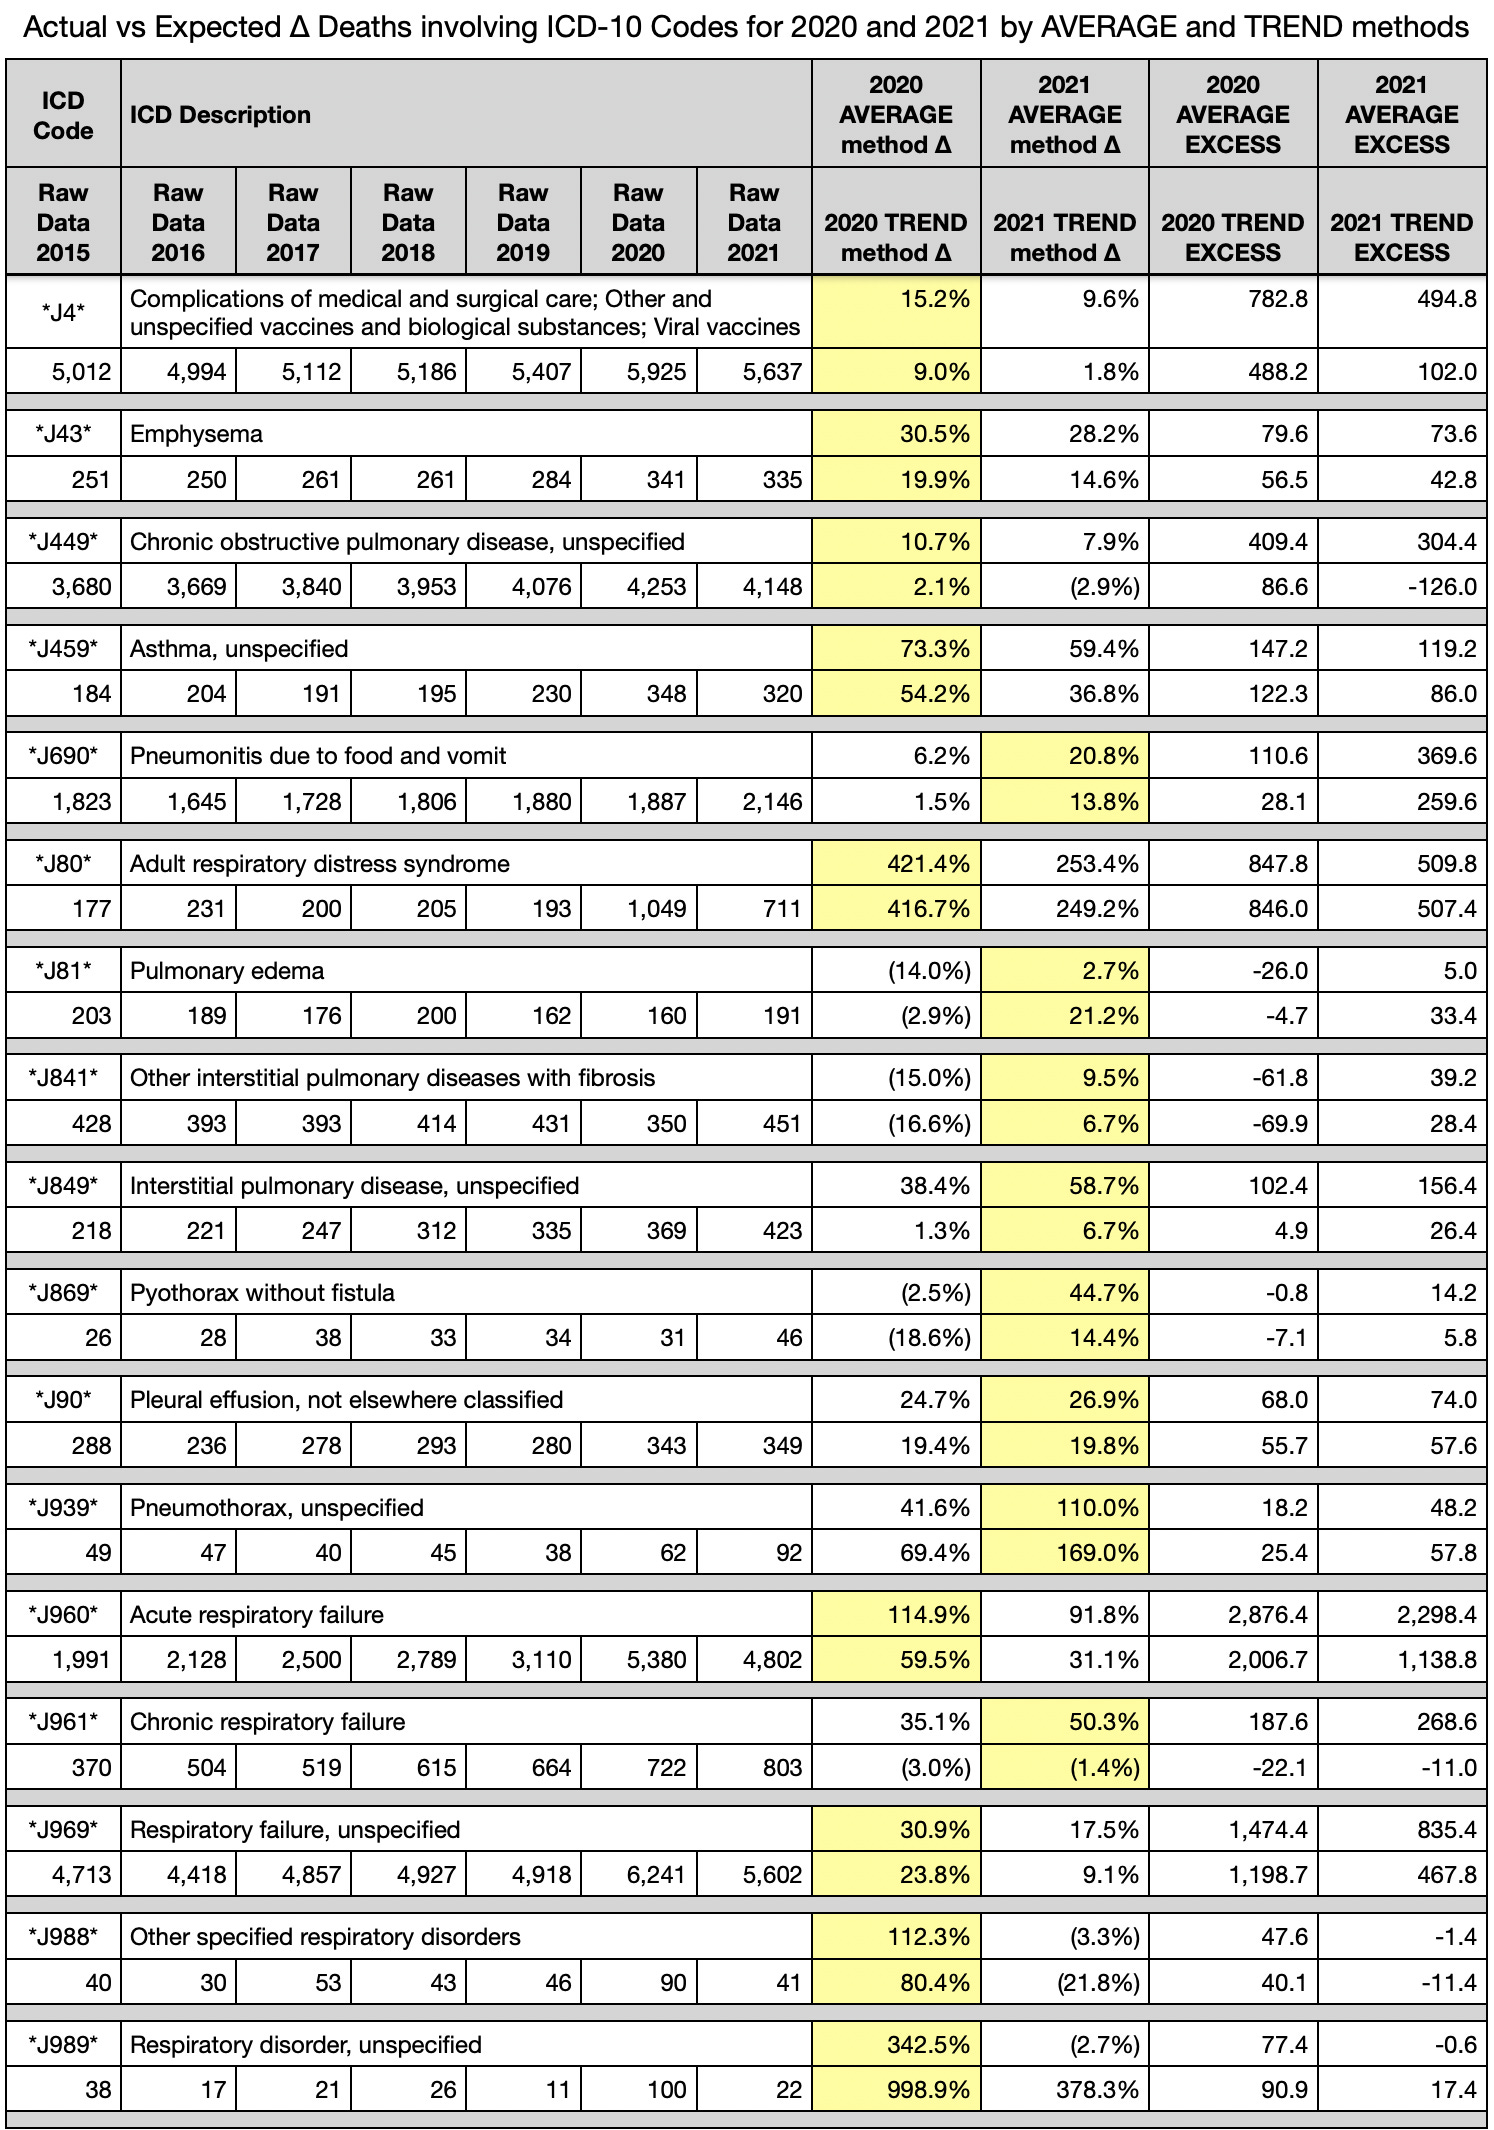
Update of the old tables from C19 Vaccine - the cause of causes
You are terrific, and it breaks my heart about your son and then to be told you can't go to the group... This is so cruel, this whole fraud and the unwitting fools who are complicit, so damn cruel. I wish I had millions I'd send you a big fat check, but all I can afford right now is my prayers for you, and my heart's vibrations to your heart... Peace to you, brother.
I'm sorry for your loss and enraged at the self righteous cunts who would deny you some solace for not being so called "vaccinated" in July 2022. Thank you for compiling these stats, I've bookmarked them and hope to read it top to bottom in the next day or so.